

- Land Acknowledgement
- Introduction
- Impossible Trade-Offs
- Top Insights
- Key Findings
- Key HungerCount Findings: Provincial Results
- Struggling to Stay Afloat
- Affordability Pressures and Eroding Financial Resilience
- Unaffordable Housing, Growing Hunger
- Looking Beyond the Poverty Line: Understanding Food Insecurity and Food Bank Use
- Spotlight: The Society-Wide Impacts of Food Insecurity
- Mental Health, Food Insecurity, and Food Bank Use
- Mapping the Intersection of Food Insecurity and Poor Self-Rated Mental Health
- Unemployment Remains a Steady Contributor to Food Bank Usage
- Food Banks at Their Limits
- Global Conflict, Local Consequences: How International Events Hit Food Banks on Two Fronts
- Top-Cited Reasons for Accessing a Food Bank This Year
- Main Sources of Income
- People Receiving Provincial Social assistance as their Main Source of Income
- The General Welfare Portion of Provincial Social Assistance
- The Disability Support Portion of Provincial Social Assistance
- Employment Insurance (EI)
- Those Accessing Food Banks with Employment as their Main Source of Income
- Housing Type
- People Living in Market Rental Housing
- People Who are Unhoused, in Temporary Accommodations or Other Non-Permanent Housing
- Demographic trends
- Age Groups
- Working-Age Adults
- Seniors
- Household Type
- Single-Person Households
- Households with Children
- Indigenous Peoples
- Racialized Groups
- Recent Newcomers
- Beyond the Supply Chain: Food Security and Food Sovereignty in Northern Canada
- Federal Policy Recommendations
- Reform Income Supports to Provide Real Support in Times of Need
- 1. Permanently reform EI for a modern workforce
- 2. Double the Canada Workers Benefit
- 3. Remove barriers to the Disability Tax Credit (DTC)
- 4. Undertake a federal parliamentary study on the adequacy of social assistance
- Invest in Critical Infrastructure to Build a More Affordable and Resilient Canada
- 5. Establish a National Housing Accord
- 6. Establish explicit geographic policy tracks within Build Canada Homes
- 7. Replace the 12-month shovel-ready rule with a Pathways to Readiness stream
- 8. Direct up to $500 million of the Food-Link Fund to strategic food infrastructure
- Build a Stronger North by Investing in People and Communities
- 9. Close the northern cost-of-living gap in the Canada Groceries and Essentials Benefit
- 10. Transform Nutrition North Canada into a transparent, accountable, Indigenous-led food security and food sovereignty program
- 11. Invest in affordable community infrastructure through Canada’s defence and dual-use commitments
- Our Methodology
- Food Bank Universe
- Data Collection
- A Note on Visits
- Analyzing the Data
- Methodological Note Re: Quebec
- Limitations
- Methodology Review
- Acknowledgements
- Sources
Land Acknowledgement
As an organization that supports a network of associations spanning coast-to-coast-to-coast, Food Banks Canada recognizes that our work takes place on the traditional territories of Indigenous Peoples who have cared for this land that we now call Canada since time immemorial.
We acknowledge that many of us are settlers and that these lands that we live, work, meet, and travel on are subject to First Nations self-government under modern treaty, unceded and un-surrendered territories, or traditional territories from which First Nations, Métis, and Inuit Peoples have been displaced.
We are committed to decolonization and to dismantling the systems of oppression that have dispossessed Indigenous people of their lands, including the land on which we operate, and denied their rights to self-determination.
Introduction
Impossible Trade-Offs
Millions of people in Canada are running out of options.
Until recently, most people in Canada could absorb a setback.
A surprise car repair. A temporary layoff. A family illness. A modest increase in rent.
What allowed households to get through these moments was not income alone. It was the financial margin that existed around that income: savings, access to credit, support from family, or assets that could be relied on, when needed. These buffers provided confidence that a difficult month would not become a prolonged crisis.
Today, that margin is disappearing.
Years of rising housing costs, insufficient housing supply, food inflation driven by global economic shocks, broader economic uncertainty, and inadequate investment in income-support systems have steadily eroded the financial buffers many households once relied on. As a result, setbacks that were once manageable now force people into impossible trade-offs.
This year’s HungerCount tells the story of what happens when millions of people begin running out of options.
Record demand reflects deeper financial pressure
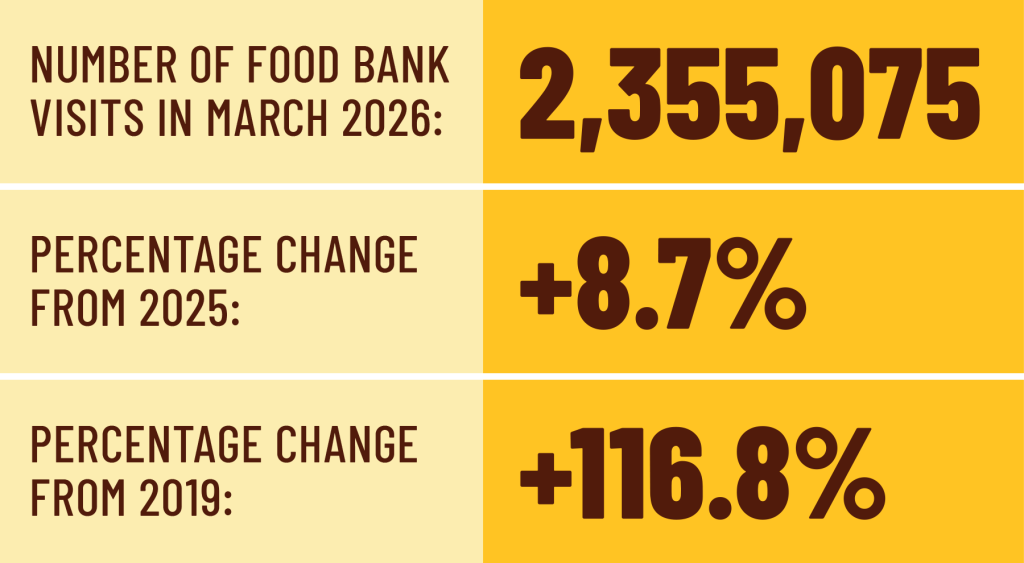
In March 2026, Canada’s food banks recorded 2,355,075 visits, the highest number ever recorded. That is 8.7% higher than last year and 117% higher than before the COVID-19 pandemic. About 776,000 of those visits were children.
Those numbers are alarming. But the more important question is: Why does food bank demand continue to grow years after the acute phase of the pandemic ended, even as inflation has slowed and many headline economic indicators have stabilized?
The answer is that financial hardship is cumulative.
People spend months or years stretching budgets, drawing down savings, accumulating debt, postponing expenses, and exhausting every available strategy to make ends meet. Some are forced to choose between paying for groceries and accessing medical treatment. Over time, the options become fewer and the consequences more severe.
When necessities cost more than people can afford
Since 2021, food prices have increased by approximately 30%, housing costs by 28%, and transportation costs by nearly 24%.
These are not discretionary purchases. They are necessities.
While earnings have grown during this period, the cost of essentials has risen more quickly than many households can reasonably absorb. By the end of 2025, households in the lowest income quintile were spending the equivalent of 112% of their disposable income on food, housing, and transportation, compared with 91% four years earlier.
How is that possible?
Households are bridging the gap by drawing on savings, borrowing money, carrying debt, delaying payments, and sacrificing long-term financial security to meet immediate needs. But those strategies have limits. As savings disappear and debt grows, everyday choices become increasingly difficult.
When households must devote nearly all their resources to necessities, even a minor setback can create a crisis.
Food insecurity is reaching far beyond traditional poverty
In 2025, nearly 10 million people across Canada lived in households experiencing food insecurity. More than 2.6 million people experienced severe food insecurity, regularly skipping meals, reducing food intake, or going entire days without eating because they could not afford food. That number has doubled since 2019.
Food insecurity is no longer affecting only those traditionally understood to be living in poverty.
It increasingly affects employed workers, families with children, newcomers building a life in Canada, and renters facing record housing costs. Many have incomes above the official poverty line yet still struggle to afford life’s essentials.
One of the most significant findings in this report is the growing disconnect between employment and financial security. For decades, work was viewed as protection against severe hardship. Today, protection is weakening. Nearly 18% of food bank users report employment earnings as their primary source of income. Low wages and insufficient work income are becoming increasingly common reasons for people seeking assistance from food banks.
Housing costs are driving food insecurity
Housing affordability has become one of the clearest predictors of food insecurity.
Food-insecure households are nearly twice as likely as food-secure households to spend at least 30% of their income on housing, and more than three times as likely to spend half of their income or more on housing.
When housing consumes a growing share of household budgets, food often becomes one of the few remaining expenses households can reduce. Increasingly, hunger is the consequence of unaffordable housing.
The impacts of food insecurity extend well beyond access to food. Food insecurity is associated with poorer physical and mental health, higher levels of stress, reduced participation in community life, and increased pressure on health and social-service systems. Hunger is not only a consequence of economic hardship: it also deepens and perpetuates it.
Food banks are reaching their limits
As households struggle under these pressures, food banks face growing challenges of their own.
The same crisis driving demand is increasing food banks’ operating costs and making it more difficult to secure sufficient food supplies. Food banks are purchasing more food than ever before and relying increasingly on fundraising to meet demand.
More than half report distributing less food than they would like because supplies or infrastructure are insufficient, while one in five report running out of food before all needs are met.
Food banks have become one of the country’s clearest indicators of economic stress. They are often the first place where the consequences of unaffordable housing, inadequate incomes, labour-market instability, and rising living costs become impossible to ignore.
A crisis of affordability demands policy solutions
The growth in food bank use is not fundamentally a food problem. It is an income problem. It is a housing problem. It is an affordability problem.
Food banks play a vital role in helping people through difficult times, but they cannot solve the underlying conditions driving food insecurity. Lasting progress requires policies that strengthen incomes, improve housing affordability, modernize Employment Insurance (EI), and ensure support systems respond effectively when people experience job loss, illness, or other disruptions to their income.
Reducing food insecurity means decreasing the number of people forced to make impossible trade-offs.
Building a more secure Canada is possible
HungerCount 2026 documents what happens when rising costs outpace incomes and financial pressures accumulate annually.
Behind every record-setting statistic is a person or family making increasingly difficult choices to get by.
The continued growth in food bank use is not inevitable. It reflects affordability challenges that can be addressed through deliberate policy action and sustained investment in the systems that help people meet their basic needs.
The challenge now is ensuring that fewer people are forced to choose between necessities, and that more have the stability and support needed to move forward with dignity and security.
Top Insights
Key Findings
In March 2026, there were more than 2.3 million visits to food banks in Canada, the highest number on record.
Food bank visits surpassed last year’s record-breaking level, reflecting the growing number of people in Canada experiencing financial hardship and record-high rates of food insecurity.
Food bank usage has more than doubled since March 2019 and is nearly 9% higher than it was in 2025.
The scale of growth over the past seven years is unprecedented in Canada’s food bank network. Food bank use has risen by almost 117% since 2019, including a nearly 9% increase in the past year alone. This places growing pressure on food banks’ ability to provide adequate support as demand continues to outpace available resources.
One-third of food bank clients are children.
The proportion of children under 18 accessing food banks continues to hold at nearly one-third of food bank clients. However, given the growth of food bank usage since the pre-pandemic period, that third now represents nearly 776,000 visits — an increase of more than 400,000 monthly visits compared to seven years ago. In addition, there has been a significant increase in the proportion of two-parent households with children under 18 accessing food banks — from 18.8% in 2019 to 20% in 2026.
Nearly 18% of food bank clients report employment as their main source of income, compared to 12% in 2019.
The proportion of food bank clients whose main source of income is employment continues to grow. This group now makes up 17.9% of food bank clients. Until 2022, when the impacts of rapid inflation took effect, they generally made up between 10% and 12% of all clients. This year, the cumulative impact of inflation has further eroded the purchasing power of people who are employed, even among those whose incomes are above the official poverty line.
Rent eats food budgets for households with the lowest incomes.
Housing costs devour most of the disposable income of low-income households. People with the lowest incomes, which includes people receiving provincial social assistance, spend on average nearly 60% of their disposable income on housing. In 2021, that figure was 49%. As non-negotiable housing costs take up a growing proportion of disposable income and savings decline, lower-income households face an increased risk of food insecurity and reliance on food banks.
Nearly 72% of food bank clients live in market rental housing.
Market renters make up 71.8% of all food bank clients, underscoring the growing link between housing affordability and food insecurity. Compared to other food bank clients, renters are more likely to be newcomers, members of racialized communities, employed, and couples with children. As rents continue to consume a larger share of household budgets, more renters are being forced to turn to food banks to make ends meet.
Grossly inadequate provincial social assistance remains the most common source of income for food bank clients.
Provincial social assistance, which includes both the general welfare and provincial disability support income streams, is the primary source of income for nearly 41% of food bank clients. As a consequence of both the extremely low-income levels and the punitive design of social assistance programs, food bank clients receiving provincial social assistance experience very high levels of food insecurity. As a result, they require help from food banks more frequently and for longer periods of time.
| Canada: Key HungerCount Findings | 2026 |
|---|---|
| Total visits | 2,355,075 |
| Total visits (children) | 775,658 |
| % change in total visits, 2025-2026 | +8.7% |
| % change in total visits, 2019-2026 | +116.8% |
| Total meals and snacks | 3,606,171 |
| Number of food banks reporting | 2,575 |
Age Categories Served as a % of Total, by Age Group
2026
| % 0-2 years | 4.1 |
|---|---|
| % 3-5 years | 5.3 |
| % 6-11 years | 11.9 |
| % 12-17 years | 11.2 |
| %18 – 30 years | 15.6 |
| % 31-44 years | 22 |
| %45-64 years | 21 |
| %65+ years | 8.9 |
2025
| %0-2 years | 4.3 |
|---|---|
| %3-5 years | 5.7 |
| %6-11 years | 12.1 |
| %12-17 years | 10.9 |
| %18-30 years | 16.1 |
| %31-44 years | 22.4 |
| %45-64 years | 20.1 |
| %65+ years | 8.3 |
2019
| % 0-2 years | 5.2 |
|---|---|
| % 3-5 years | 6.1 |
| % 6-11 years | 12.9 |
| % 12-17 years | 9.9 |
| %18 – 30 years | 16.3 |
| % 31-44 years | 20 |
| %45-64 years | 22.8 |
| %65+ years | 8.6 |
| 2026 | 2025 | 2019 | |
|---|---|---|---|
| Age categories served as a % of total, by age group | |||
| % 0-2 years | 4.1 | 4.3 | 5.2 |
| % 3-5 years | 5.3 | 5.7 | 6.1 |
| % 6-11 years | 11.9 | 12.1 | 12.9 |
| % 12-17 years | 11.2 | 10.9 | 9.9 |
| %18-30 years | 15.6 | 16.1 | 16.3 |
| % 31-44 years | 22.0 | 22.4 | 20.0 |
| %45-64 years | 21.0 | 20.1 | 22.8 |
| %65+ years | 8.9 | 8.3 | 6.8 |
| % children | 32.5 | 33.0 | 34.1 |
| % seniors | 8.9 | 8.3 | 6.8 |
Primary Source of Income
2026
| % social assistance | 26.9 |
|---|---|
| % disability-related income support | 13.8 |
| % job income | 17.9 |
| % pension | 10.2 |
| % no income | 16.6 |
| % other income | 9.2 |
| % EI | 2.6 |
| % CCB | 1.8 |
| % student loan | 1 |
2025
| % social assistance | 28.7 |
|---|---|
| % disability-related income support | 11.7 |
| % job income | 19.4 |
| % pension | 9.2 |
| % no income | 15.3 |
| % other income | 8 |
| % EI | 3.2 |
| % CCB | 2.6 |
| % student loan | 1.9 |
2019
| % social assistance | 40.1 |
|---|---|
| % disability-related income support | 17.3 |
| % job income | 12.1 |
| % pension | 9 |
| % no income | 7 |
| % other income | 6.7 |
| % EI | 3.3 |
| % CCB | 2.5 |
| % student loan | 1.9 |
| 2026 | 2025 | 2019 | |
|---|---|---|---|
| Primary source of income | |||
| % social assistance | 26.9 | 28.7 | 40.1 |
| % disability-related income support | 13.8 | 11.7 | 17.3 |
| % job income | 17.9 | 19.4 | 12.1 |
| % pension | 10.2 | 9.2 | 9.0 |
| % no income | 16.6 | 15.3 | 7.0 |
| % other income | 9.2 | 8.0 | 6.7 |
| % EI | 2.6 | 3.2 | 3.3 |
| % CCB | 1.8 | 2.6 | 2.5 |
| % Student loan | 1.0 | 1.9 | 1.9 |
Household Type
2026
| % two-parent families | 20.1 |
|---|---|
| % single-parent families | 17.4 |
| % couples with no children | 7.7 |
| % single people | 44.1 |
| % other | 10.6 |
2025
| % two-parent families | 23.1 |
|---|---|
| % single-parent families | 17.5 |
| % couples with no children | 8.8 |
| % single people | 42.2 |
| % other | 8.3 |
2019
| % two-parent families | 18.8 |
|---|---|
| % single-parent families | 18.3 |
| % couples with no children | 9.8 |
| % single people | 48.1 |
| % other | 5 |
| 2026 | 2025 | 2019 | |
|---|---|---|---|
| Household type | |||
| % two-parent families | 20.1 | 23.1 | 18.8 |
| % single-parent families | 17.4 | 17.5 | 18.3 |
| % couples with no children | 7.7 | 8.8 | 9.8 |
| % single people | 44.1 | 42.2 | 48.1 |
| % other | 10.6 | 8.3 | 5.0 |
Housing Type
2026
| % market rental | 71.8 |
|---|---|
| % social housing | 11.1 |
| % homeowners | 8 |
| % Band-owned housing | 0.5 |
| % unhoused/temporary shelter | 6.3 |
| % other | 2.2 |
2025
| % market rental | 70.4 |
|---|---|
| % social housing | 12.6 |
| % homeowners | 7.5 |
| % Band-owned housing | 0.9 |
| % unhoused/temporary shelter | 6.3 |
| % other | 2.4 |
2019
| % market rental | 70.4 |
|---|---|
| % social housing | 14.4 |
| % homeowners | 7.4 |
| % Band-owned housing | 2 |
| % unhoused/temporary shelter | 5.3 |
| % other | 0.6 |
| 2026 | 2025 | 2019 | |
|---|---|---|---|
| Housing Type | |||
| % market rental | 71.8 | 70.4 | 70.4 |
| % social housing | 11.1 | 12.6 | 14.4 |
| % homeowners | 8.0 | 7.5 | 7.4 |
| % Band-owned housing | 0.5 | 0.9 | 2.0 |
| % unhoused/temporary shelter | 6.3 | 6.3 | 5.3 |
| % other | 2.2 | 2.4 | 0.6 |
| 2026 | 2025 | 2019 | |
|---|---|---|---|
| Other demographic information | |||
| % women 18+ | 53.4 | 51.4 | 50.1 |
| % First Nations, Métis, or Inuit people | 9.9 | 9.0 | 12.3 |
| % racialized communities1 | 49.9 | 46.2 | – |
| % in Canada for less than 10 years | 30.6 | 34.0 | 12.9 |
| % post-secondary students | 7.2 | 7.6 | 5.0 |
1 “Racialized communities” refers to whether survey respondents indicated that they belong to a visible minority group as defined by the Employment Equity Act. This question was first included in the 2021 HungerCount survey.
Key HungerCount Findings: Provincial Results
Key HungerCount Finding: Provincial Resuilts
| Total visits | Total visits (children) | % change in total visits (2025-2026) | % change in total visits (2019-2026) | # of food banks reporting | Total meals and snacks provided | |
|---|---|---|---|---|---|---|
| BC | 250,505 | 75,753 | 14.0 | 100.9 | 129 | 132,277 |
| AB | 230,196 | 86,055 | 9.3 | 156.3 | 124 | 457,646 |
| SK | 61,859 | 24,015 | 11.8 | 66.2 | 39 | 114,264 |
| MB (1) | 71,127 | 27,065 | 9.5 | 113 | 285,723 | |
| ON | 846,724 | 253,520 | 10.9 | 149.3 | 553 | 740,237 |
| QC (2) | 785,889 | 274,193 | 5.3 | 127.7 | 491 | 1,708,659 |
| NB | 35,832 | 12,026 | 10.8 | 60.9 | 63 | 56,950 |
| NS | 46,627 | 14,798 | 7.4 | 81.9 | 106 | 74,856 |
| PEI | 5,125 | 1,678 | -4.2 | 73.2 | 9 | 6,957 |
| NL | 14,971 | 4,456 | -2.9 | 39.9 | 64 | 25,188 |
| YT | 2,543 | 715 | 24.2 | 131.4 | 2 | – |
| NWT/NU (3) | 3,677 | 1,383 | 29.1 | – | 10 | 3,414 |
| Age categories served as % of total, by age group | % 0-2 years | % 3-5 years | % 6-11 years | % 12-17 years | % 18-30 years | % 31-44 years | % 45-64 years | % 65+ years | % children | # of food banks reporting |
|---|---|---|---|---|---|---|---|---|---|---|
| BC | 3.8 | 4.2 | 10.9 | 11.4 | 14.1 | 22.6 | 22.4 | 10.6 | 30.3 | 112 |
| AB | 4.2 | 5.1 | 12.8 | 12.0 | 16.6 | 24.7 | 18.5 | 6.1 | 34.2 | 91 |
| SK | 4.4 | 6.1 | 14.0 | 13.3 | 16.0 | 22.4 | 18.5 | 5.3 | 37.8 | 29 |
| MB | 4.9 | 5.6 | 13.5 | 11.3 | 13.5 | 21.8 | 17.8 | 11.6 | 35.3 | 112 |
| ON | 3.8 | 4.8 | 11.4 | 11.3 | 16.6 | 21.0 | 21.4 | 9.6 | 31.4 | 521 |
| QC | 4.9 | 7.1 | 12.1 | 9.9 | 13.4 | 22.5 | 21.2 | 9.0 | 34.0 | 636 |
| NB | 4.0 | 5.4 | 12.9 | 11.3 | 15.4 | 22.7 | 22.0 | 6.3 | 33.6 | 56 |
| NS | 3.6 | 4.9 | 12.3 | 11.9 | 16.9 | 21.3 | 21.4 | 7.6 | 32.8 | 89 |
| PEI | 4.1 | 4.5 | 12.5 | 11.8 | 15.6 | 25.7 | 19.4 | 6.3 | 32.9 | 8 |
| NL | 2.9 | 4.3 | 11.2 | 10.9 | 13.2 | 23.5 | 27.0 | 7.1 | 29.3 | 42 |
| YT | 3.4 | 4.7 | 8.5 | 11.4 | 13.7 | 23.9 | 26.8 | 7.7 | 28.0 | 2 |
| NWT/NU (4) | 3.3 | 5.0 | 13.2 | 12.1 | 12.5 | 19.4 | 27.9 | 6.6 | 33.6 | 1 |
| Household type | % single-parent families | % two-parent families | % couples with no children | % single people | % "other" households | # of food banks reporting |
|---|---|---|---|---|---|---|
| BC | 14.1 | 19.0 | 10.5 | 49.4 | 7.2 | 112 |
| AB | 21.0 | 22.1 | 7.5 | 38.6 | 10.8 | 106 |
| SK | 22.9 | 21.9 | 7.0 | 38.9 | 9.4 | 34 |
| MB | 20.0 | 18.4 | 5.6 | 47.5 | 8.5 | 112 |
| ON | 16.6 | 20.7 | 7.3 | 42.8 | 12.6 | 541 |
| QC | 18.1 | 19.9 | 7.6 | 44.9 | 9.4 | 636 |
| NB | 17.8 | 19.5 | 8.2 | 46.1 | 8.4 | 61 |
| NS | 17.0 | 17.9 | 6.6 | 48.5 | 10.1 | 99 |
| PEI | 15.0 | 24.5 | 7.0 | 44.0 | 9.5 | 9 |
| NL | 24.7 | 12.4 | 10.5 | 46.2 | 6.1 | 48 |
| YT | 18.0 | 11.8 | 4.1 | 57.8 | 8.2 | 2 |
| NWT/NU (4) | 23.8 | 18.6 | 6.3 | 43.5 | 7.8 | 2 |
| Source of income | % job income | % federal Employment Insurance | % social assistance | % provincial disability support | % pension income | % student loans/scholarships | % CCB | % no income | % other income | # of food banks reporting |
|---|---|---|---|---|---|---|---|---|---|---|
| BC | 21.4 | 3.0 | 19.5 | 18.2 | 12.2 | 0.2 | 1.7 | 14.1 | 9.7 | 120 |
| AB | 17.2 | 3.0 | 14.4 | 11.1 | 7.5 | 1.0 | 6.5 | 29.1 | 10.1 | 102 |
| SK | 21.3 | 2.4 | 36.1 | 5.7 | 7.3 | 1.0 | 2.6 | 12.5 | 11.1 | 34 |
| MB | 20.2 | 3.2 | 27.9 | 13.1 | 7.4 | 0.7 | 1.1 | 16.8 | 9.6 | 112 |
| ON | 15.0 | 1.9 | 19.9 | 18.9 | 10.0 | 1.0 | 0.6 | 20.3 | 12.5 | 539 |
| QC | 21.6 | 3.4 | 46.8 | 2.8 | 11.9 | 1.8 | 2.7 | 7.3 | 1.6 | 547 |
| NB | 20.0 | 4.0 | 39.7 | 4.8 | 9.8 | 0.4 | 5.7 | 9.7 | 6.0 | 60 |
| NS | 22.9 | 4.5 | 30.4 | 11.3 | 11.1 | 0.9 | 0.7 | 12.0 | 6.4 | 98 |
| PEI | 33.4 | 5.5 | 22.4 | 5.1 | 4.9 | 0.2 | 1.0 | 19.3 | 8.3 | 9 |
| NL | 8.4 | 3.8 | 41.7 | 2.3 | 7.5 | 0.3 | 1.3 | 9.5 | 25.2 | 44 |
| YT | 11.9 | 3.6 | 37.8 | 2.8 | 4.5 | 1.2 | 0.3 | 20.9 | 16.9 | 2 |
| NWT/NU (4) | 17.7 | 2.0 | 14.6 | 3.0 | 5.6 | 0.5 | 8.6 | 31.8 | 16.2 | 2 |
| Housing type | % homeowners | % rental market tenants | % social housing tenants | % Band-owned housing | % unhoused/temporary shelters | % other housing | # of food banks reporting |
|---|---|---|---|---|---|---|---|
| BC | 8.9 | 74.4 | 5.6 | 0.6 | 7.7 | 2.7 | 118 |
| AB | 10.3 | 74.1 | 4.8 | 1.9 | 6.6 | 2.3 | 104 |
| SK | 7.7 | 72.9 | 9.0 | 2.1 | 6.1 | 2.3 | 34 |
| MB | 22.4 | 45.4 | 8.4 | 1.9 | 16.9 | 5.1 | 112 |
| ON | 5.7 | 73.0 | 12.1 | 0.0 | 6.8 | 2.4 | 526 |
| QC | 9.1 | 70.8 | 14.1 | 0.3 | 4.2 | 1.5 | .544 |
| NB | 14.3 | 67.2 | 10.9 | 0.8 | 5.6 | 1.3 | 60 |
| NS | 13.1 | 67.7 | 8.2 | 2.0 | 7.1 | 1.7 | 95 |
| PEI | 8.9 | 62.5 | 23.8 | 0.0 | 3.2 | 1.6 | 9 |
| NL | 10.0 | 62.6 | 21.8 | 0.0 | 4.5 | 1.2 | 44 |
| YT | 8.0 | 52.0 | 24.0 | 0.0 | 12.7 | 3.3 | 2 |
| NWT/NU(4) | 5.7 | 34.6 | 43.1 | 0.0 | 14.2 | 2.4 | 2 |
1 Comparison to 2019 not available due to change in provincial network structure and change in data collection methods. Compared to 2021, Manitoba saw a 115.6% increase.
2 Changes to data collection methods in Quebec affected data completeness for this reporting period. To account for missing information, projections were applied using the methodology described in the methodology section.
3 Comparison to prior years not possible for Nunavut and Northwest Territories due to changes in data estimation method.
4 Not enough data received for these variables. Results may not represent the entire territories this year.
Struggling to Stay Afloat
“At our location, the increase in usage this year is being driven by a combination of economic pressures rather than a single factor. … It is less about a single event and more about a system where incomes are not keeping pace with the real cost of living, leading more people to rely on emergency food support.”
Survey respondent, Saskatchewan
A growing share of people in Canada are experiencing a prolonged affordability crisis, forcing difficult choices today while eroding their ability to weather future financial shocks. According to Statistics Canada, the proportion of households reporting difficulty meeting essential expenses such as housing, food, and transportation more than doubled over four years, increasing from 19% in summer 2021 to 39% by spring 2025.1
Figure 1: Percentage of Canadians 15 and older reporting their household had difficulty meeting financial needs, 2021–2025
Source of data: Pinault, Lauren and Helen Foran. 2026. “Stretching the loonie: A time series analysis of financial difficulty and quality of life”. Insights on Canadian Society. April. Statistics Canada Catalogue no. 75-006-X, Chart 1.
This sustained affordability crisis helps explain the continued growth in food bank usage reflected in this year’s HungerCount results.
As affordability pressures persist and many households exhaust their savings, accumulate debt, and lose the financial capacity to absorb unexpected costs, more people are being pushed toward food banks as a means of staying afloat. With economic hardship remaining widespread, demand continues to grow with little sign of easing in the near future.
Affordability Pressures and Eroding Financial Resilience
“In March 2026, we served the most people that we ever have. We are seeing more families use our services than any other group of people, and we are hearing them say that housing, food, and fuel costs are so high that there is no money left for food.”
Survey respondent, Ontario
The experiences reported by food banks are reflected in broader economic indicators. Since 2021, the cost of essential necessities has risen substantially, placing increasing pressure on household budgets, particularly among those with the lowest incomes. Since 2021, the Consumer Price Index (CPI) has increased by more than 21%, and food, shelter, and transportation have increased by 30%, 28%, and nearly 24%, respectively.2
Figure 2: Cumulative increase in the Consumer Price Index by major component, January 2021 to March 2026
Source of data: Statistics Canada. (2026, April 20). Table 18-10-0004-01 Consumer Price Index, monthly, not seasonally adjusted. https://doi.org/10.25318/1810000401-eng
Chart adapted from Statistics Canada, Research to Insights: Perspectives on Affordability and Inequality, released January 22 2025 https://www150.statcan.gc.ca/n1/pub/11-631-x/11-631-x2025001-eng.htm. Chart 1: Cumulative increase in the Consumer Price Index by major component, January 2021 to October 2024.
“Many clients now spend 60–90% of their income on rent, leaving very little for food or other essentials. Rising food prices, with food inflation continuing to outpace wage growth, making it harder for individuals and families to afford basic groceries.”
Survey respondent, Nova Scotia
Hourly wages and average weekly earnings rose between 21% and 23% since 2021, but these gains lagged behind the rising costs of key essentials such as food and housing, eroding the purchasing power of many households despite modest gains in earnings.3
“[Our] increase is largely due to cost of living overall, but specifically groceries, housing, fuel, and utilities. We are also seeing an increase in working people, largely due to cuts in hours, or wages not keeping up with cost of living.”
Survey respondent, Alberta
For households with the lowest incomes, the cumulative impact of housing and food inflation has been especially severe. The share of disposable income devoted to shelter rose from 49% in 2021 to 57% in 2025. When food and transportation costs are included, essential expenses consumed 112% of disposable income by 2025, up from 91% just four years earlier.4
Figure 3: Percentage share of disposable income for essential items for lowest income quintile, Q1 2021 vs. Q4 2025
% share of disposable income
Q1 2021
Q4 2025
Source of data: Adapted from Affordability Action Council. (2023, December 12). Groceries and essentials benefit: Helping people with low incomes afford everyday necessities. Figure 1. IRPP. https://irpp.org/research-studies/groceries-and-essentials-benefit/. Updated figures calculated from Statistics Canada. (2026, April 13). Table 36-10-0662-01, Distributions of household economic accounts, income, consumption and saving, by characteristic, quarterly (x 1,000,000). https://doi.org/10.25318/3610066201-eng
“Many households are carrying higher levels of debt and are experiencing financial exhaustion after prolonged periods of economic pressure.”
Survey respondent, British Columbia
As essential items such as housing, food, and transportation consume a growing share of household disposable income, the ability to build a financial cushion against future shocks becomes increasingly difficult. One-third of those experiencing financial difficulty have drawn on savings or employed other strategies such as taking on additional debt or used credit to pay for day-to-day expenses.5
Strategies to manage expenses that are higher than disposable income – actions known as dissaving – have led to increasing levels of deficit for those with the lowest incomes.
Over a five-year period, households in the lowest income quintile saw their average annual dissaving increase from -$6,473 in 2020 to nearly -$11,000 by the fourth quarter of 2025. The second lowest income quintile also saw a notable decline over the same period, from -$2,229 in 2020 to -$5,523 by the end of 2025.6
Source of data: Statistics Canada. (2026, April 13). Statistics Canada, Distribution of Household Economic Accounts, table 36-10-0662-01. Chart adapted from Statistics Canada, Research to Insights: Perspectives on Affordability and Inequality, released January 22 2025 https://www150.statcan.gc.ca/n1/pub/11-631-x/11-631-x2025001-eng.htm.
The steady erosion of savings and growing reliance on debt help explain why food bank usage continues to rise. For many households, food banks are not the first response to financial hardship but rather the point reached after savings have been depleted, debts have accumulated, and other strategies for making ends meet have been exhausted.
Unaffordable Housing, Growing Hunger
“In addition to food costs, housing is, to put it simply, unaffordable. Property values and rental rates have climbed sharply over the last decade, while insurance premiums have risen significantly due to climate instability. Utility costs, energy bills, and essential services have also increased. At the same time, employment opportunities have become less stable, with some residents experiencing layoffs or difficulty securing consistent work.”
Survey respondent, British Columbia
With housing costs now consuming close to 60% of the disposable income of households with the lowest incomes, and financial cushions continuing to erode, less money remains for food and other essentials. This increases the likelihood of both food insecurity and food bank use.
The Government of Canada generally considers housing affordable when a household spends less than 30% of its gross income on shelter costs.7 Households spending more than 30% are generally considered to be experiencing unaffordable housing and to be in core housing need, while those spending 50% or more are often considered to be at heightened risk of housing instability and homelessness.8
The relationship between housing affordability and food insecurity is particularly striking. In a national survey commissioned by Food Banks Canada, it was found that nearly twice as many food-insecure households paid at least 30% or more of their income on rent or mortgage compared to food-secure households.9 As shown in Figure 5, 62% of food-insecure households spent at least 30% of their income on housing, compared with 32% of food-secure households. The gap widens further among households facing severe housing unaffordability: 30% of food-insecure households spent 50% or more of their income on housing, compared with just 9% of food-secure households.
Figure 5: Percentage of respondents paying 30% or more, and 50% or more, of household income on rent or mortgage, food-secure vs. food-insecure households
Paying 30% or more of income on rent/mortgage
Paying 50% or more of income on rent/mortgage
Source of data: Food Banks Canada Poverty Report Card survey. March 2026, N = 6,820.
Looking Beyond the Poverty Line: Understanding Food Insecurity and Food Bank Use
“Food insecurity seems to be affecting a wide cross section of the community.”
Survey respondent, Ontario
Food insecurity and food bank use are closely connected. As food insecurity has risen across Canada in recent years, food banks have seen unprecedented growth in demand. In 2025, nearly 10 million people — 24% of the population of Canada — lived in households that were experiencing some level of food insecurity,10 defined as inadequate or insecure access to food due to financial constraints. This is an increase of approximately 3.6 million compared to 2019.11
The number of people experiencing severe food insecurity — which includes missing meals, reducing food intake, and going without food for an entire day or days due to lack of money — has doubled from 1,325,700 in 2019 to 2,653,900 in 2025.12
While food insecurity has risen sharply, Canada’s official poverty rate has increased more modestly. Using the Market Basket Measure (MBM), Canada’s official poverty measure, 11% of the population lived in poverty in 2025, up from 7% in 2020.13 This represents approximately 4.5 million people. By contrast, food insecurity has grown much more rapidly and more closely mirrors the growth in food bank use observed over the same period.
One reason for this difference is that the MBM focuses primarily on household income relative to the cost of a predetermined basket of goods and services.14 Food insecurity, however, is influenced by a wider range of factors that affect a household’s day-to-day ability to afford food.
These factors are numerous and can include the household’s level of savings or debt, whether they have recently moved into a new rental unit and are paying above-average market rent, or whether they have or are caring for someone with a disability.
Both food insecurity and poverty remain important indicators of economic well-being and help identify gaps in existing policies and supports. However, food insecurity is shaped by a broader range of factors than income alone, suggesting that many households experience material hardship that may not be fully captured by income-based poverty measures.15
Spotlight: The Society-Wide Impacts of Food Insecurity
Food insecurity limits access to adequate, safe, and nutritious food and is strongly associated with broader social and structural inequities. Beyond immediate hunger, food insecurity has wide-ranging impacts on health, education, and workforce participation. Research has linked food insecurity to increased health care costs and a range of adverse physical and mental health outcomes, with implications for educational attainment, workforce participation, and overall well-being.16
At a systems level, these impacts contribute to increased health care utilization, reduced productivity, and greater demand on social and support services. Understanding these broader impacts is critical, as the consequences of food insecurity extend far beyond hunger and affect individuals, communities, and public systems.
These broader impacts were also reflected in Food Banks Canada’s participatory action research study exploring experiences of food insecurity.17 Research participants described food insecurity as a cyclical and cumulative experience in which financial hardship, poor health, and reduced participation in work, education, and community life reinforced one another over time.
The wider, cumulative impacts of food insecurity can be seen in an analysis of variables from the Canadian Community Health Survey (CCHS). Administered by Statistics Canada, the CCHS is a large-scale survey of the Canadian population and includes a range of indicators that assess health status, levels of food insecurity, and overall well-being.
Analysis of data from the CCHS illustrates how closely food insecurity is linked to a range of well-being outcomes. Individuals experiencing food insecurity were significantly more likely to report poor or fair mental and physical health, high levels of stress, and a weak sense of belonging to their community compared to their food-secure counterparts.
Figure 6: Key CCHS indicators, food secure vs. food insecure
Food Secure
Food Insecure
Source of data: 2022 Canadian Community Health Survey: Public Use Microdata File
Mental Health, Food Insecurity, and Food Bank Use
The relationship between food insecurity and mental health is particularly well documented.18 Food bankers across the country noted that mental-health challenges often intersect with poverty, housing instability, and inadequate access to supports, compounding barriers for people experiencing food insecurity.
“[One reason contributing to increased usage this year are] mental health and addictions challenges, which create barriers to stable employment, income, and housing.”
Survey respondent, Nova Scotia
“Individuals with mental health issues are struggling and they can’t even afford to leave their homes.“
Survey respondent, Newfoundland and Labrador
As both food insecurity and mental health challenges have become more prevalent since the pandemic,19 food bankers are increasingly recognizing the need for greater access to mental health support. In 2026, 62% identified improved mental health services as a top policy priority to reduce hunger in their communities, up from 50% in 2019.
Results from Food Banks Canada’s Poverty Report Card survey found that those identified as food insecure were more likely to agree that their mental health impacted their employment and financial stability than those identified as food secure.
Figure 7: Extent of agreement that respondent’s mental health impacts their ability to find work / work effectively / maintain their finances
Food Secure
Food Insecure
Source of data: Food Banks Canada Poverty Report Card survey. March 2026, N = 6,820 Q: My mental health impacts my ability to find work / work effectively / maintain my finances.
“[Food insecurity] is severe on your mental health . . . I have suffered depression and anxiety over it.”
Research participant quote
“[Food insecurity is] a real loss of hope.”
Research participant quote
“I feel very drained . . . like I’m just struggling to survive.”
Research participant quote
People accessing food banks and others experiencing food insecurity often describe the emotional and mental health toll of struggling to afford food. Research participants in Food Banks Canada’s participatory action research study described the chronic stress and anxiety that were often linked to ongoing financial strain and uncertainty about meeting basic needs. Many participants described feeling overwhelmed by the constant pressure of managing limited resources and making difficult daily trade-offs.
Feelings of shame and stigma, particularly when accessing support such as food banks or asking for help, were also mentioned in the study. These emotional responses were often compounded by societal perceptions and internalized beliefs about self-sufficiency and success.
The ongoing nature of food insecurity contributed to a feeling of being stuck and having limited opportunities to improve their circumstances, and participants spoke about a growing sense of hopelessness and emotional exhaustion. This emotional burden often intersected with physical health challenges and further affected participants’ ability to cope with the demands of daily life. As food insecurity continues to rise across Canada, these impacts are increasingly being felt not only by affected households, but by communities and public systems as a whole.
Mapping the Intersection of Food Insecurity and Poor Self-Rated Mental Health
There are parts of Canada where the intersection of food insecurity and poor mental health show a strong geographic concentration. The map below shows regions of the country with both high food insecurity and low self-reported mental health.
It is important to note that self-perceived mental health is influenced by many factors, including financial stress, housing stability, physical health, social support, experiences of discrimination, employment circumstances, and other life events.20 As a result, this map should not be interpreted as evidence that food insecurity alone causes poor mental health outcomes. However, this map reinforces the strong relationship between food insecurity and mental health and provides a geographic perspective on this relationship.
Pink or purple sections of the map show areas with higher levels of food insecurity and lower levels of self-perceived mental health — illustrating where residents are facing both greater difficulties accessing adequate food and poorer mental health outcomes at the same time.
Ultimately, the map illustrates where food insecurity and self-perceived mental health intersect, highlighting opportunities for interventions that address these interconnected challenges. While it does not explain the underlying causes of these patterns, it may help identify communities where coordinated responses to poverty, food insecurity, and mental well-being could be particularly valuable.
Figure 8: Mapping the intersection of food insecurity and poor self-rated mental health
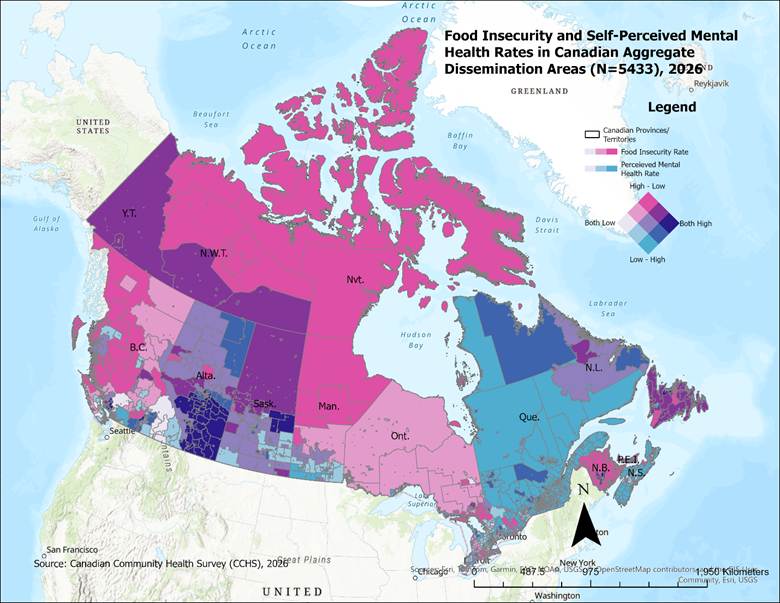
Source of data: Canadian Community Health Survey (CCHS), 2021–2022, Statistics Canada. Licensed data provided by Environics Analytics.
Unemployment Remains a Steady Contributor to Food Bank Usage
“[Increased usage this year is due to] the unknown in regards to tariffs. Companies are laying off not knowing what they will be facing.”
Survey respondent, Alberta
Despite the growing importance of inflation and affordability pressures, unemployment remains a significant contributor to food bank use across Canada.
Food bank use closely followed unemployment trends until 2022, when a surge in inflation disrupted this pattern and contributed to rising demand independently of labour market conditions. Recent labour market indicators suggest that finding work has become substantially more difficult for unemployed Canadians. The number of unemployed people competing for each job vacancy increased from roughly one-to-one in 2022 to approximately three unemployed workers per vacancy in 2025 and early 2026, a level comparable to or higher than that seen during much of the pandemic period.21 This increase in competition for available jobs suggests that unemployed workers may face longer job searches and greater difficulty replacing lost income, increasing their risk of financial hardship and food insecurity. At the time of the HungerCount survey in March 2026, the unemployment rate was 6.7%, the same as in March 2025.22
Among the general population, unemployed individuals actively looking for work experience some of the highest rates of both food insecurity and food bank use,23 highlighting how quickly people who lose employment can face financial hardship and the limitations of existing income support systems.
Figure 9: Unemployment rates and total food bank visits, March of each year, 2010–2026
Source of data: Unemployment rates from Statistics Canada. (2026, April 10). Table 14-10-0287-01: Labour force characteristics, monthly, seasonally adjusted and trend-cycle, past five months. https://doi.org/10.25318/1410028701-eng. Food bank visit numbers from Food Banks Canada 2026 HungerCount.
Food Banks at Their Limits
“… The cost of living has significantly increased expenses for lower and middle classes, which means everyone is on a tighter budget (gas, food, housing, utilities). This means less donations coming in as middle-class families are trying to afford their own food, and less help for those impacted by less donations.”
Survey respondent, Nova Scotia
The affordability crisis is not only affecting households. The same economic pressures that are driving more people to food banks are also making it more difficult for food banks to meet growing demand.
Food banks across Canada confront a structural mismatch between the factors that drive demand and those that drive supply. Demand is largely influenced by economic pressures, including housing affordability, inflation, unemployment, and low incomes, while supply depends on food and financial donations.
For many food banks, community donations remain a critical source of both food and operating revenue. Yet the same affordability pressures that are increasing demand are also limiting the ability of many households to donate, widening the gap between available resources and growing need. While some food banks have been able to forge new partnerships and new sources of supply, the disconnect between the drivers of demand and supply still means that food insecurity far outpaces food donations.
To adapt, food banks are increasingly purchasing food themselves, either to compensate for reduced donations or to meet rising demand. In 2026, nearly 80% of food banks reported purchasing food to supplement their supply, compared to 55% in 2021.
“From April 2023 to April 2026 we have seen a 49% increase in clients. Our food purchasing budget has gone up 125% and [food] donations coming in the back door are down 50% over last year … While we have not closed our doors or gone to other food banks for support, we have had to reduce the amount of food we distribute … In more and more cases, we are the only source of food for some individuals. … How can we keep this up? I’m constantly worried about the food bank, I worry about budgets, staffing, programs, all in the hope of being able to feed the people.”
Survey respondent, Quebec
Despite significant efforts to increase the food supply through fundraising, partnerships, and food purchasing, many food banks are struggling to keep pace with demand. As a result, more organizations are being forced to reduce the amount of food they distribute or are running out of food before all needs can be met. In 2026, 51% of food banks had to give out less food than usual, and 21% ran out of food before demand was met — compared to 20% and 10%, respectively, in 2021.
Figure 10: Food banks’ experiences of food shortages
2021
2026
Source of data: Food Banks Canada network survey (N = 284).
“We are currently operating without any rainy-day funds. No reserves leave us vulnerable.”
Survey respondent, Alberta
“Our usage has stayed relatively steady this year. It would have likely increased higher, but we are at the maximum visits per week that our space and appointment capacity can allow.”
Survey respondent, Newfoundland and Labrador
These findings underscore the growing limits of the current charitable food assistance model as a response to widespread and persistent food insecurity. Food banks have demonstrated remarkable adaptability by expanding partnerships, increasing fundraising efforts, and purchasing more food directly. However, as demand continues to outpace population growth and inflation places pressure on both households and charities, the gap between need and available resources continues to widen. The result is a system increasingly asked to provide long-term support despite being designed as a temporary emergency response.
Global Conflict, Local Consequences: How International Events Hit Food Banks on Two Fronts
“Increase in gas prices has increased the expenses for food deliveries, staff mileage, and the number of clients using our services.”
Survey respondent, Ontario
“Clients turn to the food bank to subsidize their budget so they can purchase a tank of gas.”
Survey respondent, Alberta
Local food insecurity is increasingly shaped by global events. Geopolitical conflict, trade disruptions, and climate-related disasters can all increase costs for households while simultaneously placing additional strain on food bank operations.
The most recent example is the sharp increase in fuel prices following supply disruptions associated with conflict in the Middle East. Because transportation costs are embedded throughout the food system, increases in fuel prices affect households and food banks, raising both the cost of everyday living and the cost of delivering food assistance. Gasoline prices surged by 21.2% in March compared to the previous month — the largest increase on record — as a supply shock associated with the conflict in the Middle East pushed fuel prices sharply higher.24
Food banks across the country reported the effects of rising fuel prices. Nearly three quarters (74%) reported a moderate or significant impact on client demand, while 67% reported impacts on their operational budgets and 60% reported impacts on transportation capacity.
“More clients are requesting food deliveries or are using the food bank because their gas bill ate into their ability to buy food. Some food retailers are now charging us a fuel surcharge to deliver our orders.”
Survey respondent, Ontario
Source of data: Food Banks Canada network survey N = 282. Q: Fuel prices surged in March 2026 due to the supply shock resulting from the conflict in the Middle East. What do you think the impact of rising fuel prices has been so far at your food bank, based on the following, if any?
Food bankers’ observations are supported by usage trends over the last year. Figure 12 shows that food bank visits and gasoline-price inflation moved more closely together following the fuel-price shock associated with the conflict in the Middle East.
Figure 12: Food bank visits (3-month moving average) and gasoline inflation, January 2025 to June 2026
Source of data: Statistics Canada. (2026, July 20). Monthly food bank visits from Food Banks Canada. Gasoline inflation from Table 18-10-0004-01 Consumer Price Index, monthly, not seasonally adjusted. https://www150.statcan.gc.ca/t1/tbl1/en/tv.action?pid=1810000401. Note: Trends come from a sample of food banks on the Link2Feed system that were able to provide food bank usage data throughout this period, representing approximately 50% of the network and 48% of total visits.
Well before the current conflict, food bankers were acutely aware of the pressures of transportation-related costs for their clients, particularly those who live in rural areas or require a vehicle for employment. Their observations are consistent with research that shows employed people experiencing food insecurity are more likely to mention the cost of gas being a significant contributor to their financial stress, and transportation challenges in general being a barrier in finding and maintaining quality employment.25
With the lowest-income households already paying 27% of their disposable income on transportation related costs at the end of 2025, along with the cumulative increases of housing and food costs, recent events further deepen financial pressure for households already facing food insecurity.
While fuel prices provide a recent and visible example, they are only one way global events affect food banks. Trade uncertainty, supply-chain disruptions, and climate-related disasters can all increase the cost of food, transportation, and other essentials. For households already struggling with housing, food, and transportation expenses, these events can deepen existing hardships and further increase reliance on food banks.
Top-Cited Reasons for Accessing a Food Bank This Year
“Even many working clients require food support due to low wages and unstable hours.”
Survey respondent, Nova Scotia
Food-price increases place disproportionate pressure on people with low incomes because food costs consume a larger share of their household budgets. As a result, the cost of food continues to be the most frequently cited reason for accessing a food bank. This response pattern from food bank clients is consistent with responses in surveys of the general population, who also cite high food costs most frequently as the main reason for their worsening financial situation.26
A notable change this year is the increase in respondents who identified low or delayed wages as the primary reason for their visit. In 2026, 22% cited this as their main reason for accessing a food bank, up from 10% in 2025. This increase likely reflects the growing share of food bank users who are employed, as well as the widening gap between wages and the rising cost of essentials such as food and housing.
Source of data: Food Banks Canada 2026.
Main Sources of Income
Behind these immediate pressures lies a longer-term story about the erosion of Canada’s income safety net. More than two decades ago, researchers warned that gaps between EI and social assistance were leaving increasing numbers of people living in Canada without adequate support.27 Today’s food bank trends suggest those warnings have become a reality.
Food banks have become a de facto “safety net” for an increasing share of the population who are not eligible for support from either federal EI or provincial social assistance — as well as those who can access these programs but do not receive adequate support from them.
People Receiving Provincial Social assistance as their Main Source of Income
Provincial social assistance is a key pillar of income support for working-age adults and generally consists of two distinct streams: general welfare and disability support. Examining food bank usage among recipients of these programs provides important insight into who is able to access these supports, who continues to face economic hardship despite receiving them, and how gaps in income adequacy continue to shape patterns of food insecurity and food bank use.
Provincial social assistance is the primary source of income for nearly 41% of food bank clients. General welfare is commonly intended as short-term assistance for people who are out of work and have no other means of financial support, and provincial disability support is for people who have disabilities or other medical conditions that present barriers to employment and are unable to find and/or hold a job.
While the portion of food bank clients receiving provincial social assistance as their main source of income has declined compared to 2019, the combined streams of social assistance remains the most common source of income for food bank clients.
Both forms of social assistance provide levels of income that fall below the official poverty threshold as outlined by the MBM, with the majority of household types receiving social assistance incomes that fall under the Market Basket Measure Deep Income Poverty threshold (MBM-DIP), hovering between 33% and 74% of the MBM.28
Due to the depth of income poverty experienced by those receiving provincial social assistance, they are also more likely to require food bank support for longer periods of time and more frequently than clients with other sources of income.29 There is also evidence of a strong relationship between increases in social assistance caseloads and increases in food bank use.30
“The cut off income for many government benefits is making it difficult for middle-income families that previously were able to get through.”
Survey respondent, Nova Scotia
Nationwide, both the general welfare and disability portions of provincial social assistance have strict eligibility requirements. To qualify (and continue to be eligible) a household must have very limited liquid assets and additional income. Often, there is no earnings exemption for a household applying for social assistance and limits on earned income for recipients before full clawbacks of that income take effect.31 Unlike recipients in income support programs that assess eligibility annually (such as the Canada Child Benefit or Guaranteed Income Supplement for seniors), those receiving provincial social assistance undergo monthly eligibility checks and can be cut off from assistance entirely — including health-related benefits — if their income from the previous month exceeded the eligible amount, even by a few dollars.32
As a consequence of both the extremely low-income levels and the punitive design of social assistance programs, the prevalence of food insecurity among people receiving provincial social assistance is almost four times that of the total population, and half of those individuals live in households experiencing severe food insecurity.33
The General Welfare Portion of Provincial Social Assistance
Since 2019, there has been a steady decrease in the proportion of food bank clients receiving the general welfare portion of social assistance — from 40.1% in 2019 to 26.9% in 2026. Taking the total growth in food bank usage into consideration, although the actual number of households that were receiving general welfare and accessing food banks has increased, that increase is not as pronounced as the growth in households receiving income from other sources (such as employment).
Those accessing food banks who rely on the general welfare portion of social assistance are more likely to be single people or single parents with children, and they are more likely to cite low levels of social assistance income as their main reason for food bank usage. Research exploring the trends of social assistance recipients in Ontario found similar results in terms of the demographic composition of general welfare recipients, with lone-parent families constituting approximately half of general welfare caseloads in that province.34 These findings point to possible persistent barriers to labour market participation for single parents, which include lack of childcare among other challenges that prevent them from finding or maintaining quality employment.35
The Disability Support Portion of Provincial Social Assistance
For many people living with disabilities, provincial disability-support programs have become the primary source of income security. Yet the rapid growth of these programs has been accompanied by persistently high rates of poverty and food insecurity, raising questions not only about access to support but also about its adequacy.
While the number of people accessing the general welfare portion of provincial social assistance has declined over time, disability-support programs have become an increasingly important component of Canada’s income-security system. The share of food bank clients whose primary source of income is provincial disability support fell from 17.3% in 2019 to just under 14% in 2026. However, because overall food bank use has increased dramatically during this period, the actual number of households receiving disability support and accessing food banks has grown.
This trend reflects a broader shift within Canada’s social assistance system. In contrast to the long-term decline in general welfare caseloads, disability-support caseloads have steadily increased nationwide. In fact, disability-support caseloads surpassed general welfare caseloads for the first time in 2019 and have continued to outnumber them ever since.36 The result is a growing concentration of low-income households with disabilities within provincial income-support systems.
One consequence of this shift has been persistently high levels of poverty and food insecurity among people with disabilities. Recent research found that financial challenges associated with disability are the strongest predictor of food insecurity in Canada. Households experiencing disability-related financial hardship were between 5 and 11 times more likely to be food insecure than households without disabilities or disability-related financial pressures.37 These elevated rates of food insecurity, combined with the growing reliance on disability-support programs, may help explain the strong relationship between disability-support caseloads and food bank use observed across Canada.
Food bank clients who rely on disability support differ in important ways from those receiving other forms of income. They are more likely to be single-person households, between the ages of 45 and 64, less likely to be recent newcomers, and more likely to identify as White. Research exploring the trends of social assistance recipients in Ontario found similar results in terms of the demographic composition of disability support recipients, with single-person households constituting the bulk of disability support caseloads in that province.38 These findings suggest that disability support increasingly serves individuals facing long-term barriers to participation in the labour market rather than people experiencing temporary periods of unemployment.
Research also suggests that the composition of disability-support caseloads is changing. In Ontario, more than half of disability-support beneficiaries were assessed as having mental health conditions, and this group has grown substantially over time while other disability categories have declined as a share of the caseload.39 This trend is consistent with observations from food banks across the country, where organizations increasingly report that unmet mental health needs, limited access to treatment and supports, and the financial impacts of living with mental illness are contributing to rising demand for food assistance.
Employment Insurance (EI)
“The increased use of our services this year is primarily due to the rising cost of living — particularly regarding food and housing — as well as the end of certain benefits, such as Employment Insurance. This situation has placed greater financial strain on many households, leading to an increase in both the number of users and the frequency of visits. Greater visibility of our services may also have contributed to this rise.”
Survey respondent, New Brunswick
The share of food bank clients whose main source of income is federal EI has remained low throughout the last seven years, hovering consistently at about 3% of all client households. This is largely due to the relatively low percentage of the general population accessing EI, which has held at under 2% of the population for over a decade (with the exception of the pandemic period in 2020 and 2021), and the low percentage of those unemployed who are currently receiving EI benefits, which consistently holds at about a third of the unemployed population.40
Food bank clients receiving EI have a profile that is more closely tied to labour-market disruptions than most other income groups. They are substantially more likely to cite recent unemployment and somewhat more likely to cite low wages or insufficient hours as reasons for food bank use. They are less likely to be recent newcomers, and more likely to identify as White. Their use of food banks appears to be linked primarily to employment instability and income loss following job separation rather than long-term reliance on public income supports.
Those Accessing Food Banks with Employment as their Main Source of Income
“Many families are still accessing the food bank despite having gainful employment, dual incomes and/or owning their own homes, as examples. Many workers are also seasonal/contractual workers making it challenging to be consistently self-sufficient.”
Survey respondent, Alberta
“Even many working clients require food support due to low wages and unstable hours.”
Survey respondent, Nova Scotia
“One of the most notable shifts is the rise in working individuals and families accessing services. These are people who, in previous years, may not have needed support but are now struggling to keep up.”
Survey respondent, Saskatchewan
For generations, paid work was assumed to provide a reliable path to economic security and protection from hardship. Increasingly, however, a growing number of people living in Canada are finding that employment alone is no longer enough to stay afloat. Rising housing costs, inflation, low wages, unstable hours, and precarious forms of employment have weakened the ability of work to protect against food insecurity, leaving more working households turning to food banks for support.
The majority of households in Canada receive their main source of income from employment, so it is not surprising that most adults experiencing food insecurity are currently employed.41 However, the growing share of food bank users who are employed represents a notable shift and suggests that the cumulative impact of inflation has substantially eroded the purchasing power of those who are employed, even if their incomes are above the official poverty line.
The proportion of food bank clients whose main source of income is employment is nearly 18%, compared to 12.1% in 2019. Although this share declined modestly from 19.4% in 2025 to 17.9% in 2026, it remains substantially higher than before the pandemic, when employed households typically accounted for between 10% and 12% of food bank clients. This trend continues to show that a significant, and steady, portion of food bank clients are employed, and we are not seeing meaningful change. The sharp increase observed after 2022 coincided with a period of rapid inflation and rising affordability pressures. The rise in the share of employed food bank clients since 2022 mirrors findings from a recent Statistics Canada study, which found that the likelihood of food insecurity increased across most demographic and economic groups after the pandemic. Notably, households that relied primarily on employment income were less likely to experience food insecurity in 2019 and 2022, but this protective effect had disappeared by 2023, pointing to weakening income security among working households.42
Figure 14: Percentage of food bank clients whose main source of income is employment, 2010–2026
Source of data: Food Banks Canada 2026 HungerCount.
Those who work and access food banks are more likely to include racialized, newcomer households, two-parent families, and are much more likely to report low wages or not enough hours as the reason for food bank use. These trends are consistent with findings that both low wages and insufficient working hours are both linked to higher levels of food insecurity among employed households.43 Consistent with this pattern, people working part time are twice as likely as full-time workers to have accessed a food bank in the past year.44
Housing Type
People Living in Market Rental Housing
“Rental units are limited, and if they are available, the cost is too high for minimum-wage earners.”
Survey respondent, Newfoundland and Labrador
“In Alberta, we continue to have no rental caps with the majority of families in private rentals. We have also noticed an increase in the number of households that have roommates or households with renters (separate units or together) and multigenerational homes to make ends meet.”
Survey respondent, Alberta
Market rentals remain the most consistent housing type for households that are accessing food banks. They represent 71.8% of all housing tenure arrangements. This finding is consistent with other research findings that show increased rates of food insecurity among market renters compared to homeowners.45 In addition, the results from Food Banks Canada’s study exploring material deprivation in Canada shows that nearly 42% of renters live in poverty, compared with 18% who own their home.46
Food bank clients who live in market rent housing are more likely to be newcomers, belong to a racialized group, earn employment as their main source of income, and be couples with children. Some key characteristics of people who are accessing food banks and live in market rent housing are consistent with characteristics of people considered “recent” renters (those who have been living in their residence for less than a year) as identified by Statistics Canada.
Recent renters pay up to 20% more in shelter costs than non-recent renters47 and are more likely to be in at least one of these categories listed, including: recent newcomers; those who are Latin American, Arab, or Black; living under the official poverty line; or living in downtown cores.48
People Who are Unhoused, in Temporary Accommodations or Other Non-Permanent Housing
“We have rural clients with addictions that are unhoused even in the winter living in old campers with no running water or heat.”
Survey respondent, Alberta
“We have seen an increase in the amount of homeless people attending our program.”
Survey respondent, Ontario
“Increase in new inflow to homelessness that is not matched by outflow to housing due to increased housing, utility, and food costs resulting in unsustainable housing and evictions.”
Survey respondent, New Brunswick
The number of food bank clients who are unhoused or have other living arrangements — including temporary or makeshift accommodations such as vehicles, hotels, and couch surfing — has increased significantly from 2019 — from 6% to 8.5%. When combined, people who are unhoused, living in temporary accommodations, or in other housing arrangements make up the third-largest housing group among food bank clients, behind those living in market rentals and subsidized housing. This increase reflects the growing issue of homelessness in Canada, which has doubled between 2018 and 2024, with “unsheltered” homelessness increasing by 300%.49
“… I also have Alberta Works clients that do not have access to computers, or phones and [am] unable to communicate with workers that are no longer located locally.”
Survey respondent, Alberta
With housing costs consuming nearly 60% of the disposable income of households in the lowest income quintile, including many food bank clients, maintaining stable housing is increasingly out of reach. As a result, more people are being pushed into homelessness or other precarious living situations. Food bank clients who are unhoused or live in precarious housing arrangements do not differ greatly from those who are housed, except that they are more likely to be single-person households, and report “no income” than those in other housing situations.
Lack of housing stability creates barriers to access benefits — particularly in provinces and territories where the shelter allowance portion of social assistance benefits are contingent on having access to housing, and where benefits are withdrawn if people lose their housing.50 Other barriers to accessing benefits for those who are unhoused include verifying one’s identity, obtaining or keeping required documents, communication issues, or technical challenges.51
Demographic trends
“We have seen an increase in usage this year, largely due to rising housing and food costs, which are putting added pressure on individuals and families. Many clients are working but still unable to keep up with the cost of living. Changes or gaps in government supports have also contributed. Additionally, we are seeing more first-time users, including seniors, newcomers, and families, indicating that financial strain is affecting a broader segment of the community.”
Survey respondent, PEI
Although HungerCount captures food bank use during a single month, comparisons over time reveal broader shifts in the demographics of those seeking assistance. Recent years have seen notable increases among employed individuals, recent immigrants, racialized populations, and two-parent households with children. However, food bank use remains disproportionately concentrated among children, renters, single-person households, and people receiving provincial social assistance. This underscores how structural economic barriers continue to shape who is most likely to need food bank support.
Age Groups
Working-Age Adults
Age provides another lens through which the growing gaps in Canada’s income-security system can be understood. While working-age adults are often grouped together in discussions of poverty and food insecurity, the pathways that lead people to food banks differ considerably across age groups. Younger adults are more likely to remain connected to the labour market and struggle with rising living costs, low wages, or unstable employment. Older working-age adults, particularly those approaching retirement age, are more likely to face barriers related to disability, declining health, or labour market exclusion, leaving many dependent on provincial disability-support programs. These differences highlight how people can become adrift in different parts of Canada’s social safety net depending on their stage of life.
“We are also seeing seniors 55–64 experiencing more barriers/gaps in service as they are “too old” for work and yet “too young” for pension.
Survey respondent, Alberta
Data from a sample of food banks in our network show that adults aged 44 and under are more likely to maintain a connection to the labour market, but struggle with low wages, insufficient work hours, and high housing costs. In contrast, clients aged 45 to 64 are more likely to rely on provincial social assistance, particularly disability benefit programs. Those relying on provincial social assistance live on incomes well below the poverty line and require more frequent and longer-term support from food banks, underscoring the inadequacy of these programs for many working-age adults.
“[F]or many Canadians with disabilities, provincial social assistance is effectively a first-resort program rather than a safety net.”52
Dr. Michael J. Prince, Lansdowne Professor of Social Policy
The prominence of provincial social assistance as a source of income among food bank clients aged 45–64 is linked to the higher prevalence of disability within this age group compared to younger working-age adults.53 More broadly, it reflects a systemic shift in Canada’s disability income support system — provincial welfare programs have become the primary source of income support for many people with disabilities, a trend that has been characterized as the “welfareization” of disability support.54
Source of data: Food Banks Canada intake database. N =>300,000
Seniors
Clients aged 65 and over represent a relatively small segment of the food bank population. However, the share of the food bank population has been steadily growing. In 2019, this group accounted for 6.8% of clients; that figure grew to 8.4% in 2025 and 8.9% in 2026. Seniors on fixed incomes have been especially sensitive to the cumulative increase in food prices, and the rise in senior food bank use underscores a broader affordability challenge facing older Canadians, especially those receiving government pensions as their primary source of income.
Seniors accessing food banks are more likely to be born in Canada or living in Canada longer than 10 years, be a single-person household, are more likely to be White, own their homes, and are more likely to mention the cost of food as the main reason for accessing a food bank.
This trend of more seniors accessing food banks aligns more closely with food-insecurity rates for this population than with the official poverty rate. While the official poverty rate for seniors 65 and older declined from 6.4% in 2021 to 5.4% in 2024,55 the food insecurity rate for persons in senior families increased from 8.4% to 9.9%, and the rate for single seniors increased 12.3% to 13% during the same period.56 The reason for this discrepancy is that the official poverty rate focuses on how much income households receive, but food insecurity captures how far that income actually goes. By reflecting the effects of cumulative increase in food prices, in addition to health expenses and rising housing costs, it reveals the affordability challenges facing many seniors whose incomes may technically place them above the poverty line, but who nevertheless struggle to meet their basic needs.
Household Type
Single-Person Households
“We gave out a record number of hampers in 2025, but actually served less people. In our tracking, this is due to serving more single-person households. The cost of living is very difficult in our community for a single person. Most people need roommates or family to make ends meet.”
Survey respondent, Alberta
Among all household types, single adults provide perhaps the clearest example of how gaps in Canada’s income-security system can translate into food insecurity. Unlike seniors, who have access to public pensions, or families with children, who can receive child and family benefits, working-age adults living alone have relatively few sources of income support available to them during periods of hardship. As a result, they are disproportionately reliant on provincial social assistance programs that provide incomes far below the cost of meeting basic needs, leaving many with little choice but to turn to food banks for support.
Single-person households remain the most common household type accessing food banks in Canada. While there has been a decline in the proportion of single-person households compared to before the pandemic (48% in 2019 vs. 44% in 2026), this is due to increased need among other household types (such as two-parent families with children), rather than reduced need among single people.
Food bank clients who are single are less likely to be newcomers to Canada, are more likely to identify as White, be among the older age groups, less likely to be receiving employment income and somewhat more likely to be receiving provincial disability assistance than other household types.
The overrepresentation of single-person households among food bank users is closely linked to the structure of Canada’s income-support system. Single adults represent most provincial social assistance cases in every province and territory57 and rely on incomes that fall far below the official poverty line in most provinces.58 With fewer income support options aside from provincial social assistance and time-limited EI support, working-age single adults who experience unemployment, disability, or other barriers to employment often have to rely on food banks because their incomes are so low.
In 2024, this policy gap meant that nearly one-third of non-senior, single individuals in the general population lived below the official poverty line and 30% experienced food insecurity, with nearly 13% experiencing severe food insecurity, nearly double the rate of the overall population.59 Together, these findings suggest that single adults remain one of the groups most exposed to the widening gaps in Canada’s social safety net, with food banks increasingly serving as a source of ongoing support rather than temporary assistance.
Figure 16: Rate of poverty according to the MBM, food insecurity and severe food insecurity, single, non-senior household vs. total
Non-senior, single person
Total
Source of data: Statistics Canada. (2026, April 29). Table 11-10-0135-01 Low income statistics by age, gender and economic family type. https://doi.org/10.25318/1110013501-eng. Statistics Canada. (2026, April 29). Table 13-10-0834-01 Food insecurity by economic family type. https://doi.org/10.25318/1310083401-eng
Households with Children
“… Many new clients with 2 incomes need help from the food bank to feed children.”
Survey respondent, British Columbia
“In March 2026, we served the most people that we ever have. We are seeing more families use our services than any other group of people, and we are hearing them say that housing, food, and fuel costs are so high that there is no money left for food.”
Survey respondent, Ontario
“Families just cannot make ends meet. The cut-off income for many government benefits is making it difficult for middle-income families that previously were able to get through.”
Survey respondent, Nova Scotia
Compared to seven years ago, there has been a slight increase in the proportion of two-parent households with children under 18 accessing food banks — from 18.8% in 2019 to 20.1% in 2026. Single-parent families have remained stable as a proportion of the food bank population over time and now represent 17.4% of food bank clients.
The proportion of children under 18 accessing food banks continues to hold at nearly one-third, or 32.5%, of food bank clients. However, given the recent growth in food bank use, that one third now represents nearly 776,000 visits — an increase of more than 400,000 visits in one month compared to seven years ago. As children under 18 represent approximately 18% of the general population,60 they remain greatly overrepresented at food banks.
Within the households with children demographic, food bank clients who are single-parent/guardian households stand out as more likely to receive provincial social assistance as their main source of income, while two-parent households are more likely to have employment as their main source of income, and are more likely to mention low wages or not enough hours at work as reasons for accessing a food bank. In regard to demographic composition, clients who are single-parent households are more likely to be female-led households, while two-parent households are more likely to be part of a racialized group and newcomers to Canada.
These differences are reflected in trends in rates of poverty and food insecurity in the broader population. Figure 17 below outlines how, for two-parent families with children, the rate of poverty is lower than that of the overall population (8.4% vs. 11%), while the rate of food insecurity is higher than for the general population (27.3% vs. 24%). Rates of both poverty and food insecurity are much higher for lone-parent families — particularly for female-led, lone-parent families — which see a poverty rate of nearly 30% and a rate of food insecurity at 47.4%.61
Figure 17: Rate of poverty according to the MBM, and food insecurity, two-parent household, and female-led, single-parent household vs. total
Below MBM
Food insecure
Source of data: Statistics Canada. (2026, April 29). Table 11-10-0135-01 Low income statistics by age, gender and economic family type. https://doi.org/10.25318/1110013501-eng. Statistics Canada. (2026, April 29). Table 13-10-0834-01 Food insecurity by economic family type. https://doi.org/10.25318/1310083401-eng. MBM rates for male-led, single-parent households not available.
Indigenous Peoples
“(Residents) are arriving from northern Quebec in search of better living conditions … specific realities faced by Indigenous people in an urban environment — such as discrimination and limited access to culturally appropriate services — also contribute to the heightened demand for the organization’s services.”
Survey respondent, Quebec
The overrepresentation of Indigenous Peoples among people accessing food banks reflects long-standing economic and social inequities that continue to shape experiences of poverty and food insecurity in Canada, rooted in the inequalities introduced through colonialism. While Indigenous communities are diverse and have distinct histories and circumstances, many continue to face barriers related to housing, employment, access to services, and income security.
In 2026, 9.9% of food bank users identified as Indigenous, despite Indigenous peoples representing only about 5% of the Canadian population. Based on the Canadian Income Survey for 2024, Indigenous peoples living off-reserve experienced food insecurity (marginal, moderate, or severe) at a rate of 34.7% compared to 24% for the total population.62 The figure is likely an underestimate in terms of overall food insecurity among Indigenous persons because of the underrepresentation of northern communities in the Canadian income survey and on-reserve populations. These segments of Indigenous people usually experience higher rates of food insecurity. Indigenous people also experience higher rates of poverty according to the MBM, with 17.9% living below the official poverty line in 2024, compared to 10.8% for the non-Indigenous population.63
Indigenous people accessing food banks are more likely to rely on social assistance and disability benefits as their primary source of income, more likely to be unhoused or in precarious housing situations, and more likely to be single parents. Indigenous clients are also the most likely to cite rising food costs and low social assistance rates as reasons for accessing a food bank.
Indigenous people in Canada face the compounding effects of inadequate income-support programs. These challenges are particularly acute in northern and remote communities, where rapidly rising food and fuel costs, combined with the impacts of climate change on traditional food sources, contribute to disproportionately high rates of food insecurity and reflect longstanding structural inequities.
Racialized Groups
Food insecurity and poverty disproportionately impact racialized groups. Long-standing labour market inequities, barriers newcomers face, and higher exposure to private rental market pressures have contributed to high rates of economic hardship among many racialized communities.64 As a result, racialized individuals continue to be overrepresented among people accessing food banks in Canada.
In 2026, 49.9% of people who accessed food banks in Canada identified as members of racialized groups, up from 46.2% in 2025 and 45.5% in 2024. Results from the Canadian Income Survey show that 30.4% of racialized individuals experience food insecurity. Rates were even higher among Black individuals, at 41.3%, more than double the rate experienced by those who were neither racialized nor Indigenous (20.4%).65 Poverty rates follow a similar pattern: 15.5% of racialized individuals live below Canada’s Official Poverty Line, rising to 16.4% of Black individuals, compared with 8.4% of those who are neither racialized nor Indigenous.66
Food bank clients who identify as members of racialized groups tend to differ from non-racialized clients in several important ways. They are generally younger, more likely to be recent newcomers, more likely to live in two-parent households, and more likely to rent housing in the private market. As shown in Figure 18, racialized clients are also more likely to report employment as their primary source of income and less likely to report provincial social assistance, including either general welfare or disability benefits, as their primary source of income. They are also more likely to cite low wages, insufficient work hours, and recent unemployment or job loss as reasons for accessing a food bank.
Figure 18: Sources of income of food bank clients by racial identity
Employment income
Provincial disability benefits
Social Assistance (Welfare)
Source of data: Food Banks Canada intake database (n>150,000).
The increase in the proportion of employed people accessing food banks since 2022 has coincided with rising representation of racialized communities among food bank clients.67 Taken together, these findings suggest that the growth in food bank use among racialized populations is closely linked to labour market challenges rather than reliance on traditional income-support programs. This is consistent with broader research showing that racialized workers are disproportionately represented among the “working poor” and are more likely to earn below the low-pay threshold than non-racialized and non-Indigenous workers. This threshold is defined as hourly wages that are less than two-thirds of the median wage.68
Recent Newcomers
“… Additionally, newcomers often face barriers to securing employment that offers a living wage, and that aligns with their education and professional qualifications, further limiting their ability to achieve financial stability.”
Survey respondent, Ontario
Newcomers to Canada who have been in the country for 10 years or less account for nearly 31% of food bank clients — down slightly compared to last year but a significant increase from 2019 when they represented 13% of clients.
Among food bank clients, newcomers are more likely to be younger two-parent families with children. Compared to non-newcomers, they are more likely to rely on employment as their primary source of income, less likely to receive provincial social assistance, more likely to rent in the private market, more likely to be racialized, and more likely to identify low wages or insufficient work hours as the reason for accessing a food bank.
Results from the Canadian Income Survey show that in 2025 nearly 31% of newcomers to Canada experienced food insecurity, compared with 24% of the general population.69 Poverty rates are also substantially higher among newcomers, with 15.9% of newcomers living below Canada’s Official Poverty Line, compared with 8.7% of those who were born in Canada.70
Figure 19 highlights differences in income sources among food bank users according to their length of time in Canada. These results should not be interpreted as a progression experienced by individual newcomers over time, but rather as a comparison of distinct groups. Food bank users who have been in Canada for fewer than two years are more likely to report having no income and less likely to receive government benefits, while those who were born in Canada or have lived in Canada for more than 10 years are more likely to rely on government benefits as a primary source of income.
Figure 19: Primary income source by length of time in Canada, percent of households using food banks
N=>60,000
Source of data: Food Banks Canada intake database.
Compared to the general population in Canada, newcomers are overall more likely to be overqualified for their current job,71 and more likely to be involuntarily working part time or in other precarious jobs such as gig work.72 Nearly 3 in 10 recent newcomers earn below the low-pay threshold — as defined as the proportion of employees earning less than two-thirds of the median hourly earnings.73 Even though many are required to pay taxes, newcomers are the least able to access EI benefits.74
Beyond the Supply Chain: Food Security and Food Sovereignty in Northern Canada
Poverty and food insecurity rates are significantly higher across the territories than they are in the provinces. The Canadian Income Survey, 2024 reveals that just over 17% of people in the territories lived under the official poverty line, compared to 11% for all of Canada.75
In the territories, 25.2% of persons experience moderate or severe food insecurity, compared to 18.4% for the provinces.76 Nunavut has the highest poverty (31.7%)77 and food-insecurity (56.4%) rates among all the territories.78 People who live in the North can end up paying between 35% to 40% of their household income on food, compared to the average of 11% for Canadians.79
These challenges reflect more than income alone. Many northern and remote communities face exceptionally high food, transportation, housing, and energy costs, while geographic isolation can make access to goods, services, and employment opportunities more difficult. Indigenous communities in particular continue to experience the lasting impacts of colonialism, alongside climate-related disruptions that affect traditional food systems and community well-being.
As a legacy of colonialism, many Indigenous communities have been located in remote and northern regions that face greater environmental challenges and are increasingly vulnerable to climate-related disasters such as wildfires. In addition to the longer term disruption of traditional food gathering activities such as hunting and fishing, evacuations are one of the top reported impacts of wildfires for Indigenous peoples.80 Between 1980 and 2021, 42% of wildland fire evacuation events were from communities where more than half of residents were Indigenous.81 Nearly three-quarters of Indigenous people who had experienced a wildfire-related evacuation reported that it occurred within the previous five years, highlighting the growing scale of the challenge.82 Evacuations can be both materially and psychologically disruptive, while wildfire smoke poses additional health risks.83 These impacts can compound food insecurity in communities already facing high food costs, housing shortages, limited health services, and transportation barriers.
Although existing programs have helped address food affordability challenges in northern and remote communities, gaps in coverage, coordination, and long-term funding remain.84 The recent review of Nutrition North Canada concluded that food security and food sovereignty are inseparable and that northern food insecurity cannot be addressed through a market-based approach alone.85 Instead, lasting progress will require sustained investments in Indigenous-led food systems, infrastructure, essential services, and community well-being.86
As Canada increases its focus on Arctic sovereignty and northern development, addressing poverty and food insecurity must remain part of the conversation. Long-term progress will depend not only on reducing the cost of food, but also on strengthening housing, transportation, infrastructure, community services, and economic opportunities across northern and remote communities.
Federal Policy Recommendations
Canada’s food insecurity crisis is a reflection of how well our systems provide people with the resources and conditions they need to meet their basic needs. In March 2026, food banks recorded more than 2.35 million visits, an increase of nearly 117% since 2019. The number of people experiencing severe food insecurity has doubled over the same period, from 1.33 million in 2019 to 2.65 million in 2025. This is a clear sign that something isn’t working.
These trends cannot be explained by a temporary economic shock alone. They reflect growing pressures on the systems people in Canada rely on to maintain an adequate standard of living. Household incomes have not kept pace with the rising cost of essential goods and services, including food, housing and transportation, while many households have little capacity to absorb further increases. One-third of people experiencing financial difficulty report drawing on savings, taking on additional debt, or using credit to cover day-to-day expenses. For households with the lowest incomes, these coping strategies are increasingly becoming a part of everyday survival.
Food insecurity is both an income-security problem and a reflection of the systems that shape the cost and accessibility of essential goods and services. While these pressures are being felt across Canada, they are particularly acute in northern and remote communities, where high costs, infrastructure gaps and persistent poverty create additional barriers to food security and well-being.
Canada needs a stronger foundation for economic security, more resilient systems for providing essential goods and services, and a long-term approach that recognizes the distinct realities of northern communities. This means reforming income supports so they provide real protection in times of need, investing in critical food and housing infrastructure to improve affordability and resilience, and ensuring that federal investments in the north strengthen communities and reduce persistent gaps in food security, housing, and well-being.
Reform Income Supports to Provide Real Support in Times of Need
1. Permanently reform EI for a modern workforce
Global uncertainty, tariffs, and persistently high unemployment are exposing long-standing weaknesses in Canada’s income support system. Built for a postwar labour market of stable, full-time jobs with a single employer, EI has not kept pace with a workforce increasingly defined by part-time, temporary, and contract work. It now covers a shrinking share of workers, disproportionately shutting out youth, people with disabilities, and racialized Canadians.
Eligibility is tied to accumulating insurable hours within a fixed period, with thresholds that vary by region. As a result, only about one-third of unemployed Canadians receive regular EI benefits, and those who do qualify receive just 55% of previous earnings, up to $729 per week.87 EI remains the primary income source for only about 3% of food bank clients, yet recipients who access food banks are especially likely to have recently lost a job or hours, suggesting existing benefits do not adequately replace lost income.
Food Banks Canada welcomes the government’s temporary EI measures for workers affected by the current trade disruption, but the recurring need for tariff-specific relief is a red flag: EI keeps requiring emergency top-ups rather than functioning as a durable safety net. Temporary measures should be the foundation for permanent reform, not a substitute for it. Canada needs a modern EI system for a modern workforce:
- Expand access: establish a uniform national eligibility threshold of 420 hours and a hybrid hours-and-weeks model to better capture part-time, seasonal, and irregular work.
- Include non-standard workers: strengthen enforcement against worker misclassification and create a contribution-based pathway for self-employed and gig workers.
- Improve adequacy: introduce a minimum weekly benefit floor of at least $450 and raise the replacement rate above the current 55%.
- Protect access across life events: create a separate EI stream for caregiving and illness.
- Strengthen transitions: introduce a second support stream for people who exhaust benefits before finding work, extending income and employment supports for up to one year alongside enhanced training and job-matching; and count time in recognized education, training, apprenticeships, and national service toward eligibility for younger workers.
2. Double the Canada Workers Benefit
Nearly one in six food bank clients are employed, underscoring that a job is no longer protection against food insecurity. Low or delayed wages were the primary reason for accessing a food bank for 22% of respondents in 2026, more than double the 10% recorded in 2025. The issue is not just whether someone has work, but whether earnings are sufficient, predictable, and available when bills are due.
The Canada Workers Benefit is meant to strengthen the return on employment, but its maximum value and phase-out thresholds are too low to close the gap between wages and living costs. In 2025, the maximum benefit was $1,633 for single individuals and $2,813 for families, phasing out at adjusted net incomes of $26,855 and $30,639 respectively.88 Food Banks Canada recommends doubling the maximum benefit, raising the income threshold to at least the poverty line, and indexing both to inflation.
3. Remove barriers to the Disability Tax Credit (DTC)
Canadians with disabilities are nearly 50% more likely to experience poverty and twice as likely to experience food insecurity.89 The DTC is required to access the Canada Disability Benefit (CDB), making it the primary gateway to federal disability supports. However, it was never designed for that role, and Statistics Canada estimates only 14.6% of persons with disabilities are eligible to claim it. An overly restrictive definition of disability and persistent administrative barriers exclude the majority from programs meant to guarantee an adequate standard of living.
While we support recent administrative changes expected to unlock an estimated $345 million90 in support over six years, fundamental reform is still needed. We call on the federal government to commit to a collaborative process to design a new eligibility system that:
- Uses the Accessible Canada Act’s definition of disability as the starting point for federal disability programs.
- Creates a centralized, dignified, rights-based disability status determination process outside the tax system.
- Automatically extends federal disability certification to people already receiving provincial or territorial disability assistance.
Pending that redesign, the government should also remove barriers within the existing DTC process, including: a plain-language application co-designed with medical practitioners, people living with disabilities, advocates, community navigators, those who have used or tried to access the DTC, continued expansion of practitioners authorized to certify disability, direct reimbursement for practitioners who certify applications, simplified, less frequent renewals — building on Manitoba’s pilot, and increased funding for the Disability Benefit Navigation program.
4. Undertake a federal parliamentary study on the adequacy of social assistance
Social assistance is a provincial and territorial responsibility, but its inadequacy is now a national concern. Provincial social assistance remains the main income source for approximately 40% of food bank clients when general welfare and disability supports are combined, and incomes have not kept pace with the cost of living anywhere in the country.
The problem extends beyond benefit levels: restrictive asset rules, monthly income testing, limited earnings exemptions, and abrupt clawbacks make it difficult to accept temporary work or build savings.
We recommend that the House of Commons Human Resources, Skills and Social Development and the Status of Persons with Disabilities committee and the Standing Senate Committee on Social Affairs, Science and Technology undertake a federal study on provincial, territorial, and on-reserve income-support systems. The study should lead to measurable federal action, with the objective that no publicly funded income-support program leaves recipients unable to afford food and shelter.
Invest in Critical Infrastructure to Build a More Affordable and Resilient Canada
5. Establish a National Housing Accord
Housing policy is food-security policy. Nearly three in four (71.8%) food bank clients rent in the private market, meaning that rising rents and worsening rental affordability have become significant drivers of food bank demand. The relationship extends beyond food bank use: food-insecure households are more than twice as likely as food-secure households to live in unaffordable housing. As housing costs consume a growing share of household budgets, more households are left with too little income to consistently afford food and other essentials.
With transfers under the National Housing Strategy expiring, the federal government should establish a National Housing Accord — a long-term framework for coordinated federal, provincial, territorial, municipal, and Indigenous investment — to ensure that the transition to Build Canada Homes preserves and strengthens the affordability supports needed by low-income renters and households facing the greatest risk of housing and food insecurity.
The accord should renew and expand funding for deeply affordable, supportive, co-operative, non-profit, and public housing; protect the existing stock of lower-cost rental housing; accelerate construction through federal land, financing, and tax measures; include dedicated streams for priority populations; require transparent annual reporting; and examine options to strengthen direct affordability supports for renters, including the continuation or replacement of existing housing benefits.
6. Establish explicit geographic policy tracks within Build Canada Homes
A single national delivery framework cannot respond to the different cost structures and governance arrangements across urban, rural, remote, and Indigenous communities. Build Canada Homes should establish three tracks: an urban and suburban track for communities of 30,000 or more; a small-town and rural track for communities of 1,000 to 30,000, with flexible density requirements and recognition of local supply chains; and a remote, northern, and Indigenous track with different cost benchmarks. Costs in the North can run two to three times those in southern Canada, and this track should coordinate with planned federal investment in Arctic security, transportation, and energy so that a sustained Canadian presence in the North comes with adequate civilian housing and services.
7. Replace the 12-month shovel-ready rule with a Pathways to Readiness stream
Requiring projects to be construction-ready within 12 months favours communities that already have serviced land and planning capacity. Remote, northern, and many Indigenous communities need more time for land preparation, environmental processes, consultation, and seasonal transportation. Build Canada Homes should fund a Pathways to Readiness stream covering housing-needs assessments, land-use planning, engineering and design, permitting, and project-management capacity so communities can enter the pipeline before they meet a conventional definition of shovel readiness.
8. Direct up to $500 million of the Food-Link Fund to strategic food infrastructure
The federal government should direct up to $500 million of the Food-Link Fund to food terminals, regional food hubs, warehousing, cold and frozen storage, processing, and transportation across the food bank network. Investment should build on infrastructure the network has already developed, target strategic gaps and priority locations, connect regional hubs across provincial and territorial boundaries, complement existing private-sector supply chains, and ensure investment reaches communities facing the greatest barriers to food access. The network has already built the relationships, data, and operational knowledge to move food across Canada. What is needed now is strategic public investment to connect, align, and scale that capacity.
Build a Stronger North by Investing in People and Communities
9. Close the northern cost-of-living gap in the Canada Groceries and Essentials Benefit
A nationally uniform benefit cannot provide equal support when costs vary dramatically by geography. People in northern and remote communities can spend 35 – 40% of household income on food, compared with roughly 11% nationally. The Canada Groceries and Essentials Benefit should include a northern supplement with higher maximum amounts, expanded eligibility thresholds, geographic adjustments for food, freight, fuel, and shelter costs, automatic indexing, and delivery systems accessible to people with limited internet or banking access. The design and implementation must be designed with territorial governments and Inuit, First Nations, and Métis leadership so it reflects the actual cost of northern life. The federal government should also provide predictable, multi-year funding for Jordan’s Principle, the Inuit Child First Initiative, and the National School Food Program in First Nations communities, since short-term extensions undermine their preventive purpose.
10. Transform Nutrition North Canada into a transparent, accountable, Indigenous-led food security and food sovereignty program
Food security is inseparable from food sovereignty. While reducing the cost of store-bought food remains important, food insecurity in the North is also shaped by poverty, climate change, and the ongoing impacts of colonialism on Indigenous food systems. The Nutrition North Canada review reinforced that food insecurity cannot be addressed through retail subsidies alone. Nutrition North Canada must be reoriented from a narrow retail subsidy toward a transparent, accountable, collaborative, community-led food security strategy.
- Reform the retail subsidy to improve affordability, choice, dignity, and transparency. Establish clear affordability targets for subsidized foods, strengthen accountability and public reporting, and broaden eligible foods to better reflect community needs and preferences.
- Expand food sovereignty initiatives. Increase long-term funding for the Harvesters Support Grant and Community Food Programs Fund, strengthen Indigenous leadership in program governance, and support harvesting, food sharing, and other community-led approaches that improve access to country foods and strengthen local food systems.
11. Invest in affordable community infrastructure through Canada’s defence and dual-use commitments
Canada’s expansion of Arctic defence and dual-use infrastructure is an opportunity to address longstanding deficits in housing, transportation, energy, and food systems. Federal investments should support affordable and supportive housing; transportation, logistics, storage, and community food infrastructure that reduce food costs, improve food-system resilience, and strengthen food sovereignty; long-term regional planning; community-benefit agreements and Indigenous procurement; and Indigenous rights and jurisdiction. A meaningful, long-term investment in the North would strengthen Arctic sovereignty while improving food security and community well-being.
Our Methodology
The annual HungerCount is Food Banks Canada’s signature report documenting food bank use in Canada. It is a cross-sectional census survey of most food bank agencies, organizations, and programs, within and outside of the Food Banks Canada network. The HungerCount provides a point in time snapshot of food bank use in Canada.
In addition to the HungerCount survey results, this report draws on evidence from a range of sources, including administrative data, national polling, Statistics Canada data, GIS mapping, and participatory action research. Together, these sources provide a more comprehensive understanding of food bank use and food insecurity, combining population-level trends with the lived experiences of people and communities across Canada.
Food Banks Canada is always looking for ways to improve the HungerCount report. If you have questions about the report, or ideas on how we could improve it, we would like to hear from you. Please get in touch at info@foodbankscanada.ca and put HungerCount in the subject line of your message.
Food Bank Universe
Within the Food Banks Canada’s network there are 10 provincial organizations; one territorial association; 814 affiliate food banks, with nearly 3,000 agencies included in them; and three direct affiliates in the two territories. There are also independent food banks operating outside the network that are included in the survey.
Data Collection
The HungerCount survey is sent out to food banks in February of each year, and the data is collected for the month of March. We use March as the study period because it is an unexceptional month, without predictable high- or low-use patterns. By using March consistently, we can track usage patterns across the years.
To maximize data integrity and minimize interpretation errors, the survey includes examples of how the data is collected and categorized. It also includes definitions of the categories.
The survey is sent to food banks and meal programs through the provincial organizations and directly to food banks not affiliated with Food Banks Canada. It is available through an online link and as a PDF and a Word document. In some cases, phone interviews are also necessary. The food bank network of Feed Ontario, Feed Nova Scotia, and approximately 180 food banks in other provinces, including non-affiliated Salvation Army food banks, use an online program called Link2Feed. These food banks were given the option to skip client usage questions in the online survey because their data could be obtained through Link2Feed.
A Note on Visits
Starting from the 2018 HungerCount, Food Banks Canada has reported the number of visits to food banks in March to provide a better representation of the need for food banks across Canada.
A “visit” counts each person once for each time they receive a hamper of food, as well as each person in their household. For example, a single person who accessed the food bank four times in March would count as four visits. A single parent with two children who accessed the food bank twice in March would count as a total of six visits.
Each food bank determines the number of times people in their community can access its services, driven by their mission, community need, and available resources. In some cases, people can visit a food bank multiple times per month; in other cases, people can visit less than once per month. Most food banks in Canada assist clients once per month.
The total number of visits incorporates visits to the food banks for a grocery basket or hamper that generally consists of a few days’ to a week’s worth of food, with a mixture of perishable and non-perishable items. Some individual food banks that have been recently engaging in larger-scale food recovery initiatives run these as separate programs in addition to their hamper programs, enabling them to quickly distribute specific food items that may be in abundance at a given time, such as fruits, vegetables, and bread. Because these food banks must distribute a high volume of these foods very quickly due to their perishability, they offer more frequent visits to enable a quicker turnover of food. As these programs typically consist of specific food items only, they are counted as a different program than the traditional hamper programs. For the purposes of data consistency, recovery program pick-ups have been excluded from the total number of visits.
Analyzing the Data
Survey data is entered into a database and cleaned to ensure a robust analysis, including filtering results to include only food bank and meal programs and verifying any outliers to ensure responses did not skew the overall results.
We recognize that errors may arise during data collection processes. Food Banks Canada undertakes extensive follow-up with food bank outliers (those that deviate +/−25% in any given year). However, the +25% range produced too many outliers because of the dramatic rise in the number of clients seen by food banks across the country this year, so this range was altered on a province-by-province basis to target true outliers. Food Banks Canada staff performed the analysis using Statistical Package for Social Sciences (SPSS). The overall usage number is based on primary data received directly from organizations. We combine total visits from all responding valid surveys and calculate household results using only surveys with complete data in those categories.
The data was processed in SPSS and descriptive analysis was conducted. Proportions of categorical variables were calculated and compared with other categories of the variables and with the findings of the previous surveys. The outputs were also tabulated and plotted in an Excel spreadsheet.
In cases where surveys were not completed by operating food banks, conservative estimates were made by verifying that a food program still exists and using regional data to apply a percentage increase or decrease to previously reported numbers. Outliers were removed from the regional data to ensure trends are not over-reported.
To analyze responses to client demographics, a sample of food banks that responded to the relevant questions was used. Response rates for the demographic questions remain consistent year to year. Demographic data was analyzed at the national level to ensure a robust sample representation, with missing cases excluded from the analysis. Where comparisons of demographic items were presented, samples were tested for statistical significance using t-tests to look for differences between two independent samples.
An additional analysis of demographic data was conducted using client-level, disaggregated data from the Food Banks Canada intake database. The data was collected from a sample of food banks that use the system and consented to share their data with Food Banks Canada. While the sample is numerically robust, it may not be geographically representative.
Methodological Note Re: Quebec
Due to changes in data collection methods in Quebec, complete data were not available for this reporting period. Accordingly, projections were generated to estimate missing values and ensure the provincial estimates were as comprehensive as possible. To estimate missing values, an average growth rate was calculated using the 459 organizations that reported either positive growth in visits or a decline of less than 50% compared with the previous reporting period. This average growth rate was then applied to the 196 organizations that either did not report 2025 data or reported a decline greater than 50%. A threshold of a 50% decline was used to identify organizations for which reported changes were more likely to reflect incomplete reporting rather than actual declines in service activity. No projections were made for new organizations or those not yet reporting through the system, as approximately 83% of organizations in Quebec reported through the data collection system during this cycle.
Limitations
Food banks across the country operate with limited resources and capacity for documentation. In some cases, Food Banks Canada follows up with outliers to find out if there was a reporting error in a previous year. In these instances, corrections can be made to data from past years. Discrepancies are often minor and do not impact the overall trends. Food Banks Canada makes every effort to ensure that the data presented is as accurate as possible.
Methodology Review
In the fall of 2018, the Social Research and Demonstration Corporation (SRDC) conducted a review of the HungerCount methodology and made several recommendations for the coming years. Overall, the SRDC found that HungerCount is a survey program that provides rich data about the experiences of people facing economic hardship, food insecurity, and barriers to basic needs. HungerCount provides a robust snapshot in any given year of food bank use, as well as key demographics of the populations who use food banks across Canada. Several quality control checks are in place to minimize measurement and response errors in data collection phases.
Food programs participating in the HungerCount 2026 survey
| Province | # of Affiliates | # of Organizations Participating | Food Bank Only | Meal Only | Both | # Agencies included in Affiliate Surveys | Total |
|---|---|---|---|---|---|---|---|
| AB | 109 | 125 | 90 | 1 | 34 | 892 | 1017 |
| BC | 111 | 131 | 85 | 0 | 46 | 707 | 838 |
| MB | 12 | 114 | 86 | 0 | 28 | 307 | 421 |
| NB | 68 | 70 | 54 | 6 | 10 | 111 | 181 |
| NL | 60 | 64 | 53 | 0 | 11 | 7 | 71 |
| NS | 134 | 141 | 86 | 32 | 23 | 94 | 235 |
| NT | 2 | 6 | 1 | 1 | 4 | 0 | 6 |
| NU | 1 | 8 | 1 | 1 | 6 | 0 | 8 |
| ON | 145 | 665 | 485 | 83 | 97 | 433 | 1098 |
| PEI | 9 | 9 | 5 | 0 | 4 | 20 | 29 |
| QC | 33 | 1225 | 6 | 2 | 1217 | 0 | 1225 |
| SK | 35 | 40 | 27 | 1 | 12 | 77 | 117 |
| YT | 1 | 2 | 2 | 0 | 0 | 15 | 17 |
| Total | 720 | 2600 | 981 | 127 | 1492 | 2663 | 5263 |
Acknowledgements
Food Banks Canada would like to thank the hundreds of thousands of people who access food programs, and the thousands of staff and volunteers who contribute information to the HungerCount report every year. Without their efforts and participation this research would not be possible. Special thanks goes to André Turcotte, Senior Advisor at Pollara Strategic Insights, for his assistance.
We also would like to thank the HungerCount 2026 Provincial Coordinators:
Dan Huang-Taylor, Food Banks BC (British Columbia)
Darryl Burry, Food Banks Alberta (Alberta)
Michael Kincade, Food Banks of Saskatchewan (Saskatchewan)
Meaghan Erbus, Harvest Manitoba (Manitoba)
Amanda Colella-King, Feed Ontario (Ontario)
Erin Waddington, Feed Ontario (Ontario)
Noémie Robidoux, Food Banks of Quebec (Quebec)
Stéphane Sirois, Food Depot Alimentaire (New Brunswick)
Carrie Delaney, Food Depot Alimentaire (New Brunswick)
Epiphany Spielman, Feed Nova Scotia (Nova Scotia)
Nathan Corkum, Feed Nova Scotia (Nova Scotia)
Mike MacDonald, Upper Room Food Bank (Prince Edward Island)
Tina Bishop, Community Food Sharing Association (Newfoundland and Labrador)
Heather Sealey, Food Bank Society of the Yukon (Yukon)
Design by The Garden
Copyediting by Brigitte Petersen
HUNGERCOUNT WAS PREPARED BY
Richard Matern, Sofia Seer, Dana Vreeswijk, Oona Palmer, Nick McRoberts, Sarah Faubert, and Khoaja Khaled
Copyright 2026 Food Banks Canada. All rights reserved.
Recommended citation: Food Banks Canada (2026). HungerCount 2026. Mississauga: Food Banks Canada.
Sources
1Pinault, L., & Foran, H. (2026, April). Stretching the loonie: A time series analysis of financial difficulty and quality of life (Catalogue no. 75-006-X).Statistics Canada. https://www150.statcan.gc.ca/n1/pub/75-006-x/75-006-x2026002-eng.htm
2Statistics Canada. (2026, April 20). Consumer Price Index, monthly, not seasonally adjusted (Table 18-10-0004-01) [Data table]. https://www150.statcan.gc.ca/t1/tbl1/en/tv.action?pid=1810000401
3Statistics Canada (2026, Tables 18-10-0004-01, 14-10-0065-01, 14-10-0223-01).
4Figure based on data from Statistics Canada. (2026, April 13). Distributions of household economic accounts, income, consumption and saving, by characteristic, quarterly (x 1,000,000) (Table 36-10-0662-01) [Data table]. https://doi.org/10.25318/3610066201-eng
5Gellatly, G., Foran, H., & Pinault, L. (2024, December 19). Barriers to moving: Potential implications for the life satisfaction of young families. Economic and Social Reports, 4(12), 1–5. https://doi.org/10.25318/36280001202401200001-eng
6Statistics Canada. (2025, January 22). Chart 4: Average household net saving by income quintile [Chart]. In Research to insights: Perspectives on affordability and inequality. https://www150.statcan.gc.ca/n1/pub/11-631-x/11-631-x2025001-eng.htm
7Canada Mortgage and Housing Corporation. (2024, September 10). 2022 Canadian Housing Survey: New insights into housing needs and conditions. The Housing Observer. https://www.cmhc-schl.gc.ca/observer/2024/2022-canadian-housing-survey
8Canadian Observatory on Homelessness. (n.d.). What are the causes of homelessness? Homeless Hub. https://homelesshub.ca/collection/homelessness-101/what-are-the-causes-of-homelessness/
9National, representative survey conducted by Pollara Strategic Insights on behalf of Food Banks Canada of 6,820 adult Canadians conducted March 6 – 21, 2026. Weighted to reflect Canadian population per Statistics Canada census data. Margin of error: ±1.5 percentage points. Food insecurity assessed using six-item module developed by the Economic Research Service of the United States Department of Agriculture (USDA)
(Economic Research Service, 2012).
10Statistics Canada. (2026, April 29). Canadian Income Survey, 2024. The Daily. https://www150.statcan.gc.ca/n1/daily-quotidien/260429/dq260429a-eng.htm
The latest data release from Statistics Canada’s 2024 Canadian Income Survey (CIS) uses 2024 tax filer data to provide poverty rates based on the Market Basket Measure (MBM), Canada’s official measure of poverty. However, data collection for the food-insecurity scale took place from January to June 2025, referencing the respondents’ experiences for the previous 12 months. Therefore, we are using the more recent year as the reference years when referring to food-insecurity data collected by the CIS.
11Statistics Canada. (2026, April 29). Food insecurity by economic family type (Table 13-10-0834-01) [Data table]. https://doi.org/10.25318/1310083401-eng
12Statistics Canada. Table 13-10-0834-01.
13Statistics Canada (2026), Canadian Income Survey, 2024.
14Employment and Social Development Canada. (2018, August 21). Opportunity for all: Canada’s first poverty reduction strategy (Annex 1: The statistical fine print). Government of Canada. https://www.canada.ca/en/employment-social-development/programs/poverty-reduction/reports/strategy.html#h2.15
15Montcho, G., & Al-Azzam, M. S. (2026). Determinants of food insecurity in Canada: A machine learning approach. Employment and Social Development Canada. https://www.canada.ca/en/employment-social-development/corporate/reports/research/determinants-food-insecurity-canada.html
16Tarasuk, V., Cheng, J., de Oliveira, C., Dachner, N., Gundersen, C., & Kurdyak, P. (2015). Association between household food insecurity and annual health care costs. Canadian Medical Association Journal, 187(14), E429-E436. https://doi.org/10.1503/cmaj.150234; Gundersen, C., & Ziliak, J. P. (2015). Food insecurity and health outcomes. Health Affairs, 34(11), 1830–1839. https://doi.org/10.1377/hlthaff.2015.0645
17Participatory Action Research (PAR) brings people with lived experience into the research process as partners, ensuring that findings reflect real-world realities and inform meaningful action. This approach is particularly valuable for understanding complex issues such as food insecurity and identifying solutions grounded in lived experience.
18PROOF. (2018, February 22). Food insecurity and mental health. University of Toronto. https://proof.utoronto.ca/resource/food-insecurity-and-mental-health/
19Statistics Canada. (2024). Health of Canadians, 2024: Health outcomes. Government of Canada. https://www150.statcan.gc.ca/n1/pub/82-570-x/2024001/section2-eng.htm and Statistics Canada (2026), Canadian Income Survey, 2024
20Li, AKC., & Nowrouzi-Kia, B. (2024) Relationships between employment status with self-perceived mental and physical health in Canada. AIMS Public Health. 11(1), 236–257. doi: 10.3934/publichealth.2024012; Caramenti, M., & Castiglioni, I. (2022). Determinants of self-perceived health: The importance of physical well-being but also of mental health and cognitive functioning. Behavioral Sciences, 12(12), 498. https://doi.org/10.3390/bs12120498; Statistics Canada. (2020, June 24). Health Reports: Understanding the self-perceived mental health of Canadians during the COVID-19 pandemic. The Daily https://www150.statcan.gc.ca/n1/daily-quotidien/200624/dq200624b-eng.htm; Koppner, J., Lindelöf, A., Iredahl, F., Tevell, M., Nilsson, S., Thorsell, A., Faresjö, Å., & Israelsson Larsen, H. (2024). Factors affecting self-perceived mental health in the general older population during the COVID-19 pandemic: a cross-sectional study. BMC public health, 24(1), 660. https://doi.org/10.1186/s12889-024-18199-1; McDonald, H. (2021, September 8). Self-perceived mental health and mental health care needs during the COVID-19 pandemic. Statistics Canada. https://www150.statcan.gc.ca/n1/pub/45-28-0001/2021001/article/00031-eng.htm
21Statistics Canada. (2025, March 18). Job vacancies, fourth quarter 2024. The Daily.https://www150.statcan.gc.ca/n1/daily-quotidien/250318/g-b001-eng.htm; Statistics Canada. (2026, March 17). Job vacancies, fourth quarter 2025. The Daily.https://www150.statcan.gc.ca/n1/daily-quotidien/260317/dq260317a-eng.htm; Statistics Canada. (2026, June 16). Job vacancies, first quarter 2026. The Daily.https://www150.statcan.gc.ca/n1/daily-quotidien/260616/dq260616b-eng.htm
22Statistics Canada. (2026, April 10). Labour force survey, March 2026. The Daily. https://www150.statcan.gc.ca/n1/daily-quotidien/250404/dq250404a-eng.htm
23Food Banks Canada (2026). From Peer Insights to a Population-Based Survey: Challenges and opportunities faced by people who are employed and experiencing food insecurity. https://foodbankscanada.ca/from-peer-insights-to-a-population-based-survey/
24Statistics Canada. (2026, April 20). Consumer Price Index, March 2026. The Daily. https://www150.statcan.gc.ca/n1/daily-quotidien/260420/dq260420a-eng.htm
25Food Banks Canada. (2026). From peer insights to a population-based survey: Challenges and opportunities faced by people who are employed and experiencing food insecurity. Food Banks Canada. https://foodbankscanada.ca/from-peer-insights-to-a-population-based-survey/#h-employment-related-financial-stress-and-barriers-to-quality-employment
26Based on quarterly surveys commissioned by Food Banks Canada and conducted by Pollara Strategic Insights via online survey, from national sample of 1,500 Canadians, from April 2024 to April 2026.
27Boychuck, G. W., & McIntosh, T. (2001). Adrift between islands: Employment Insurance, social assistance and the politics of income support in Canada. Canadian Review of Social Policy, (47).https://crsp.journals.yorku.ca/index.php/crsp/article/view/33771
28Laidley, J., & Oliveira, T. (2026). Welfare in Canada, 2025: A crisis of inadequacy. Maytree. https://maytree.com/publications/welfare-in-canada-2025-a-crisis-of-inadequacy/
29Kneebone, R., Wilkins, M., Jardine, M., & Zwicker, J. (2026). Social policy trends: Food bank use by AISH recipients. The School of Public Policy Publications, 19(1). https://doi.org/10.55016/rwh21x52; Black, J. L., & Seto, D. (2020). Examining patterns of food bank use over twenty-five years in Vancouver, Canada. Voluntas: International Journal of Voluntary and Nonprofit Organizations, 31(5), 853-869. https://doi.org/10.1007/s11266-018-0039-2
30Kneebone, R. D., & Wilkins, M. (2017, December 13). Social policy trends: Calgary food bank clients and social assistance caseloads. The School of Public Policy Publications, 10(2017). https://doi.org/10.11575/sppp.v10i0.43228
31Laidley & Oliveira, 2025, pp. 223–237.
32Laidley & Oliveira, 2025, p. 226.
33Li, T., Fafard St-Germain, A. A., & Tarasuk V. (2023). Household food insecurity in Canada, 2022. Research to Identify Policy Options to Reduce Food Insecurity (PROOF). https://proof.utoronto.ca/
34Zhang, X. (2025, January 30). Recent trends in social assistance in Ontario. Statistics Canada. https://www150.statcan.gc.ca/n1/pub/75f0002m/75f0002m2025002-eng.htm
35Food Banks Canada. (2026). Single people with dependents. In Peer insights to a population-based survey. https://foodbankscanada.ca/from-peer-insights-to-a-population-based-survey/#h-single-people-with-dependents
36Oliveira, T., & Caballero, M. (2026). Social assistance summaries, 2025. Maytree. https://maytree.com/wp-content/uploads/Social_Assistance_Summaries_2025.pdf
37Montcho & Al-Azzam, 2026.
38Zhang, 2025.
39Zhang, 2025.
40Statistics Canada. (2026, August 7). Table 14-10-0287-01: Labour force characteristics, monthly, seasonally adjusted and trend-cycle, last 5 months. https://doi.org/10.25318/1410028701-eng; Statistics Canada. (2026, July 23). Table 14-10-0011-01: Employment insurance beneficiaries (regular benefits) by province and territory, monthly, seasonally adjusted. https://doi.org/10.25318/1410001101-eng
41Li et al., 2023.
42Fafard St-Germain, A.-A., Li, T., & Tarasuk, V. (2025). Changes in households’ vulnerability to food insecurity in Canada before and after the COVID-19 pandemic. Health Reports, 36(12), 3–13. https://doi.org/10.25318/82-003-x202501200001-eng
43PROOF. (2026, January 15). The main income earner of most food-insecure working households has a permanent, full-time job, new research reveals. University of Toronto. https://proof.utoronto.ca/2026/the-main-income-earner-of-most-food-insecure-working-households-has-a-permanent-full-time-job-new-research-reveals/
44Food Banks Canada. (2026) From Peer Insights to a Population-Based Survey. https://foodbankscanada.ca/from-peer-insights-to-a-population-based-survey/#h-prevalence-of-food-insecurity-and-food-bank-use-within-subgroups
45Uppal, S. (2023, November 14). Food insecurity among Canadian families. Insights on Canadian Society. Statistics Canada. https://www150.statcan.gc.ca/n1/pub/75-006-x/2023001/article/00013-eng.htm
46Mendelson, M., Notten, G., Matern, R., & Seer, S. (2024). Poverty in Canada through a deprivation lens. Food Banks Canada. https://fbcblobstorage.blob.core.windows.net/wordpress/2024/06/FBC_2024PovertyInCanada_ENG_v6.pdf
47MacIsaac, S., & Wavrock, D. (2025, August 27). Renters’ shelter costs by duration of tenancy. Economic and Social Reports. https://doi.org/10.25318/36280001202500800003-eng
48Statistics Canada. (2023, October 4). A tale of two renters: Housing affordability among recent and existing renters in Canada. https://www12.statcan.gc.ca/census-recensement/2021/as-sa/98-200-X/2021016/98-200-X2021016-eng.cfm
49Canadian Alliance to End Homelessness. (2026, August 6). Homelessness is a housing problem in Canada. https://caeh.ca/news/homelessness-is-a-housing-problem-canada/
50Laidley & Oliveira, 2025; Balata, L. (2026, January 28). Rising homelessness is no mystery — it’s socially assisted. Maytree. https://maytree.com/publications/rising-homelessness-is-no-mystery-its-socially-assisted/
51Canada Revenue Agency. (2018). Ethnography of homeless and housing-insecure Canadians’ experiences filing taxes and accessing benefits. Government of Canada. https://www.canada.ca/en/revenue-agency/programs/about-canada-revenue-agency-cra/corporate-reports-information/ethnography-homeless-experiences.html
52Prince, M. J. (2015). Entrenched residualism. In P.-M. Daigneault & D. Béland (Eds.), Welfare reform in Canada: Provincial social assistance in comparative perspective (pp. 289–304). University of Toronto Press.
53Statistics Canada. (2013, December). Disability in Canada: Initial findings from the Canadian Survey on Disability (Catalogueno. 89-654-X, No. 002). https://www150.statcan.gc.ca/n1/pub/89-654-x/89-654-x2013002-eng.pdf
54Stapleton, J., Tweedle, A., & Gibson, K. (2013, February). What is happening to disability income systems in Canada? Council of Canadians with Disabilities. http://www.ccdonline.ca/en/socialpolicy/poverty-citizenship/income-security-reform/disability-income-systems#sec-trend
55Statistics Canada. (2026). Food insecurity by economic family type (Tables 13-10-0834-01 and11-10-0135-01) [Data table]. https://doi.org/10.25318/1110013501-eng
56Statistics Canada. (2026, April 29). Food insecurity by selected demographic characteristics (Table 13-10-0835-01) [Data table]. https://doi.org/10.25318/1310083501-eng
57Oliveira & Caballero, 2025.
58Laidley & Oliveira, 2025.
59Statistics Canada. (2026). Canadian Income Survey, 2024.
60Statistics Canada. (2025, September 24). Population estimates on July 1, by age and gender (Table 17-10-0005-01) [Data table]. https://doi.org/10.25318/1710000501-eng
61Statistics Canada. (2026, April 29). Low income statistics by age, gender and economic family type. (Table 11-10-0135-01) [Data Table] https://doi.org/10.25318/1110013501-eng; Statistics Canada. (2026, April 29). Food insecurity by economic family type. (Table 13-10-0834-01) [Data table] https://doi.org/10.25318/1310083401-eng
62Statistics Canada, Food Insecurity by Selected Demographic Characteristics.
63Statistics Canada. (2026, April 29). Poverty and Low-Income Statistics by Selected Demographic Characteristics. (Table 11-10-0093-01) [Data table] https://www150.statcan.gc.ca/t1/tbl1/en/tv.action?pid=1110009301
64Gill, J. (2025, August 18). Employees with low pay, 2024. Quality of Employment in Canada. Statistics Canada. https://www150.statcan.gc.ca/n1/pub/14-28-0001/2025001/article/00002-eng.htm; Statistics Canada, A Tale of Two Renters: Housing Affordability Among Recent and Existing Renters in Canada.; and Statistics Canada. (2026, April 7). Labour market experiences of recent immigrants, 2019 to 2025. The Daily. https://www150.statcan.gc.ca/n1/daily-quotidien/260407/dq260407a-eng.htm.
65Statistics Canada, Food Insecurity by Selected Demographic Characteristics.
66Statistics Canada, Poverty and Low-Income Statistics by Selected Demographic Characteristics.
67In 2022, racialized communities represented 32.5% of people accessing food banks.
68Gill (2025).
69Statistics Canada, Food Insecurity by Selected Demographic Characteristics.
70Statistics Canada, Poverty and Low-Income Statistics by Selected Demographic Characteristics.
71Statistics Canada, Labour Market Experiences of Recent Immigrants, 2019 to 2025.
72Perley-Robertson, B., & Monteiro, S. (2026, April 16). A scorecard for immigrant skill utilization. Signal49 Research. https://www.signal49.ca/in-fact/a-scorecard-for-immigrant-skill-utilization_apr2026/; Statistics Canada. (2024, June 13). Labour market characteristics of persons with and without disabilities, 2023. Labour Statistics at a Glance. https://www150.statcan.gc.ca/n1/pub/71-222-x/71-222-x2024002-eng.htm
73Gill (2025).
74Laing, M., & Laryea, S. (2022). The labour market experiences of immigrants: An analysis of Employment Insurance usage, eligibility and contribution patterns. Employment and Social Development Canada. https://www.canada.ca/en/employment-social-development/corporate/reports/research/employment-insurance-labour-market-experience-immigrants.html
75Statistics Canada. (2026, April 29). Low income statistics by age, gender and economic family type (Table 11-10-0135-01) [Data table].https://doi.org/10.25318/1110013501-eng
76Statistics Canada, Food insecurity by economic family type.
77Statistics Canada, Low-income statistics by age, gender and economic family type.
78Statistics Canada, Food insecurity by selected demographic characteristics.
79Crown-Indigenous Relations and Northern Affairs Canada. (2025, December). Evaluation of the Nutrition North Canada Horizontal Initiative. Government of Canada. https://www.rcaanc-cirnac.gc.ca/eng/1771338268896/1771338291254
80Hohban, L., Strong, K., Trottier, S., & Larocque, H. (2026, July 28). (2026): Wildfire-related evacuations in Indigenous communities. Statistics Canada. https://www150.statcan.gc.ca/n1/pub/16-002-x/2026001/article/00002-eng.htm
81Christianson, A. C., Johnston, L. M., Oliver, J. A., Watson, D., Young, D., Macdonald, H., Little, B. M., Bautista, N. G. (2024). Wildland fire evacuations in Canada from 1980 to 2021, International Journal of Wildland Fire, 33(7). https://doi.org/10.1071/WF23097
82Statistics Canada, Wildfire-Related Evacuations in Indigenous Communities.
83Statistics Canada, Wildfire-Related Evacuations in Indigenous Communities.
84Crown-Indigenous Relations and Northern Affairs Canada. (2026, June 26). Minister’s Special Representative submission on Nutrition North Canada. Government of Canada. https://www.nutritionnorthcanada.gc.ca/eng/1781709808624/1781709823117; Tasker, J. P. (2024, February 9). First Nations leaders decry federal decision to rein in Jordan’s Principle funding. CBC News. https://www.cbc.ca/news/indigenous/jordans-principle-funding-reaction-9.7118249; Antunes, J. (2026, February 19). Liberals extend Inuit Child First Initiative for 1 year again. Nunatsiaq News. https://nunatsiaq.com/stories/article/liberals-extend-inuit-child-first-initiative-for-1-year-again/; Palmater, P., & Joseph, M. (2025). Fragile progress: Analysis of past spending and future commitments on MMIWG2S+ Calls for Justice. Canadian Centre for Policy Alternatives. https://www.policyalternatives.ca/news-research/fragile-progress-analysis-of-past-spending-and-future-commitments-on-mmiwg2s-calls-for-justice/.
85Crown-Indigenous Relations and Northern Affairs Canada, Minister’s Special Representative Submission on Nutrition North Canada.
86Crown-Indigenous Relations and Northern Affairs Canada, Minister’s Special Representative Submission on Nutrition North Canada.
87Statistics Canada. (2026, April 9). Labour force characteristics, monthly, seasonally adjusted and trend-cycle, last 5 months (Table 14-10-0287-01) [Data table] https://www150.statcan.gc.ca/t1/tbl1/en/tv.action?pid=1410028701; Statistics Canada. (2026, August 19) Employment insurance beneficiaries (regular benefits) by province and territory, monthly, seasonally adjusted (Table 14-10-0011-01) [Data table] https://www150.statcan.gc.ca/t1/tbl1/en/tv.action?pid=1410001101; Employment and Social Development Canada. (n.d.). Employment Insurance (EI) regular benefits: How much you could receive. Government of Canada. https://www.canada.ca/en/services/benefits/ei/ei-regular-benefit/benefit-amount.html.
88Canada Revenue Agency. (2026, April 8). How much you can get. https://www.canada.ca/en/revenue-agency/services/tax/individuals/topics/about-your-tax-return/tax-return/completing-a-tax-return/deductions-credits-expenses/line-45300-canada-workers-benefit-cwb/how-much-you-can-get.html
89Hébert, B.-P., Kevins, C., Mofidi, A., Morris, S., Simionescu, D., & Thicke, M. (2024, May 28). A demographic, employment and income profile of persons with disabilities aged 15 years and over in Canada, 2022. Statistics Canada; Statistics Canada (2026), Canadian Income Survey, 2024.
90Department of Finance Canada. (2026, May 29). Secretary of State Long highlights actions to make it easier to access the Disability Tax Credit [News release]. Government of Canada. https://www.canada.ca/en/department-finance/news/2026/05/secretary-of-state-long-highlights-actions-to-make-it-easier-to-access-the-disability-tax-credit.html

